
Figure 2.
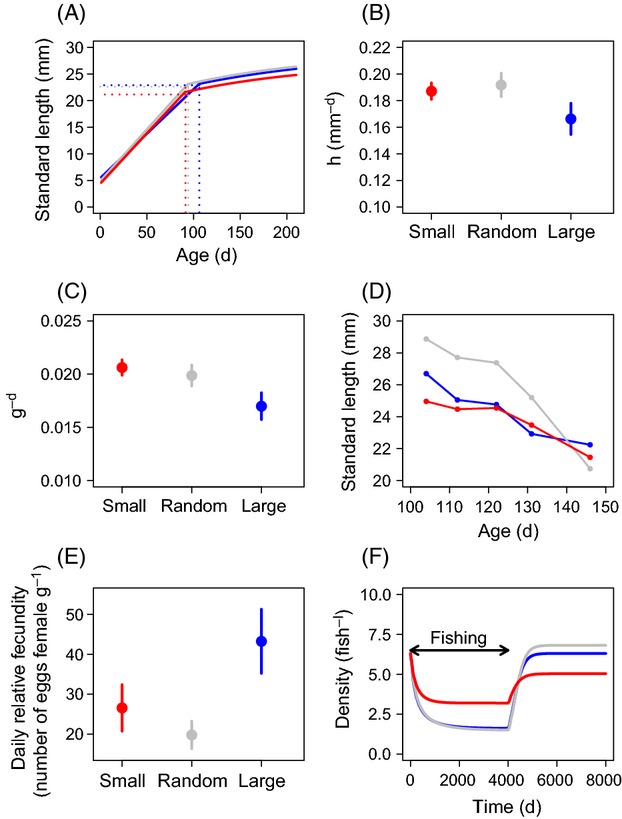
Differences among selection lines in life-history traits and reproductive output. Data are mean ± SEM for panels (B), (C), and (E). Red, gray, and blue symbols and lines represent populations of small-, randomly, and large-selected fish, respectively. (A) Biphasic growth curves (dotted lines refer to treatment-specific age T and length at maturity L). (B) Average juvenile growth rate (h) (small-selected 0.190 ± 0.045; random 0.194 ± 0.040; large-selected 0.167 ± 0.025 mm−d). (C) Average daily reproductive investment (g) (small-selected 0.021 ± 0.003; random 0.020 ± 0.004; large-selected 0.017 ± 0.005). (D) 50% quantiles for the probabilistic maturation reaction norms (PMRNs; note that most plastic responses in maturation shift the phenotype along the reaction norm, whereas an evolutionary response in maturation shifts the reaction norm itself). (E) Average relative fecundity (small-selected 26.6 ± 5.83; random 19.8 ± 3.44; large-selected 43.3 ± 8.03 eggs/g female). (F) Simulated population-level consequences of life-history changes induced by size-selective harvesting. Population recovery was monitored after large-size harvested fishing was operated for the first 4000 days.