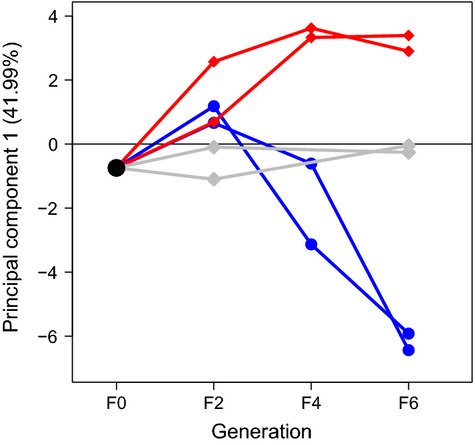
Figure 3.

A principal component analysis on allele frequencies of the 22 outlier loci illustrates a similar amount and direction of genetic change occurred among the selection lines induced by size selection after five generations of harvesting. Red lines and symbols indicate small-, gray randomly, and blue large-selected replicates.
