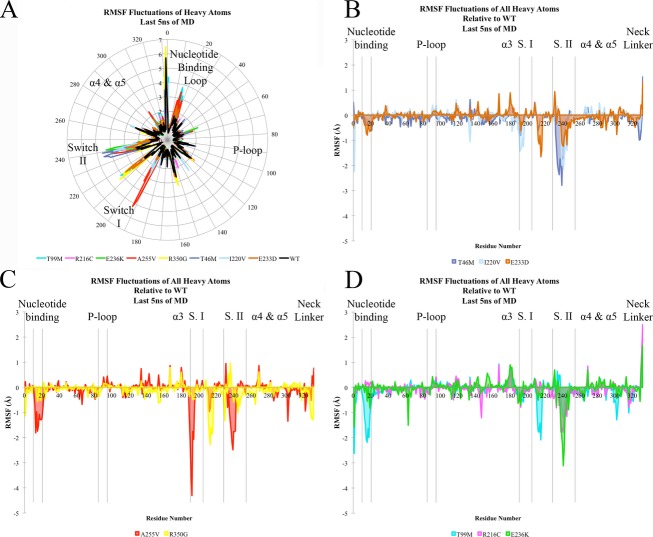
Figure 3.
Motor domain molecular dynamic simulation. (A–D) RMSF (root mean square fluctuation) of KIF1A motor-ATP complex over the final 5 nsec of simulation time based on heavy atoms of each residue. (A) Radial representation of RMSF values (Å) for all mutants and wild-type (WT) simulation. (B–D) Depiction of the extent of flexibility relative to the WT simulation, in which a negative number corresponds to a higher degree of flexibility. (B) corresponds to the autosomal dominant de novo mutations, (C) to the recessive mutants, and (D) to rare polymorphic variants from the exome variant server. The color-coding legend for the different mutations is represented at the bottom of each panel.

