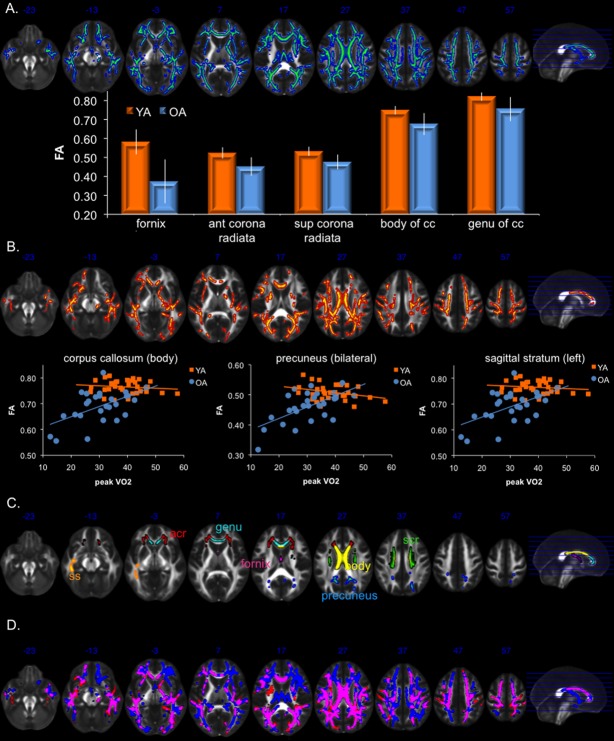
Figure 1.
(A) White matter regions with reduced FA in older adults relative to younger adults (blue), as well as bar graphs of mean FA (error bars represent SD) of selected regions showing some of the strongest age effects. Blue numbers near the anterior portion of the brain represent MNI coordinates of the image in the z-direction. (B) White matter regions showing a significant peak VO2 by age group interaction (red), driven by a positive relationship between FA and peak VO2 in older adults and no relationship in younger adults. Scatter plot and best-fit line for YA (orange) and OA (blue) in selected regions showing the strongest interaction. (C) ROIs used to extract data plotted in (A and B). (D) Overlap (pink) of age-effect (blue) and peak VO2 by age group interaction (red). Pink regions show both the main effect of age-related decline and the peak VO2 by age group interaction. Statistical maps were dilated using tbss_fil to facilitate visualization. acr, anterior corona radiata; ant, anterior; cc, corpus callosum; FA, fractional anisotropy; ROI, region of interest; L, left; OA, older adults; scr, superior corona radiata; sup, superior; ss, sagittal stratum; YA, young adults.

