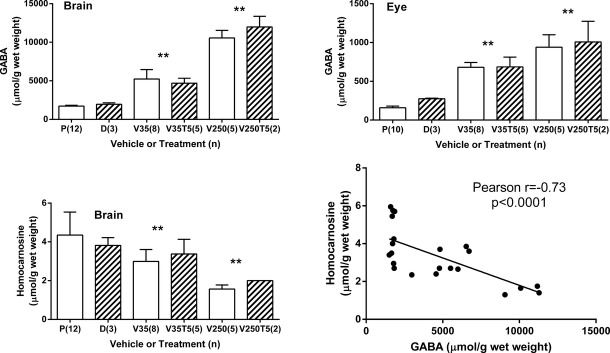
Figure 2.

Total GABA and homocarnosine in mouse brain and eye extracts. Parenthetical values represent the subject number. Error bars = SEM. X-axes: P, PBS; D, DMSO; V35, vigabatrin (35 mg/kg); V35T5, vigabatrin (35 mg/kg) supplemented with Torin 1 (5 mg/kg); V250, vigabatrin (250 mg/kg); V250T5, vigabatrin (250 mg/kg) supplemented with Torin 1 (5 mg/kg). One-way ANOVA, all bar graphs, P < 0.0001 (post hoc t test, **P < 0.01, which compares the mean of VGB dose with/without Torin versus vehicle mean [DMSO or PBS]). The linear regression curve highlights the inverse relationship between GABA and homocarnosine in brain. PBS, phosphate-buffered saline; VGB, vigabatrin.
