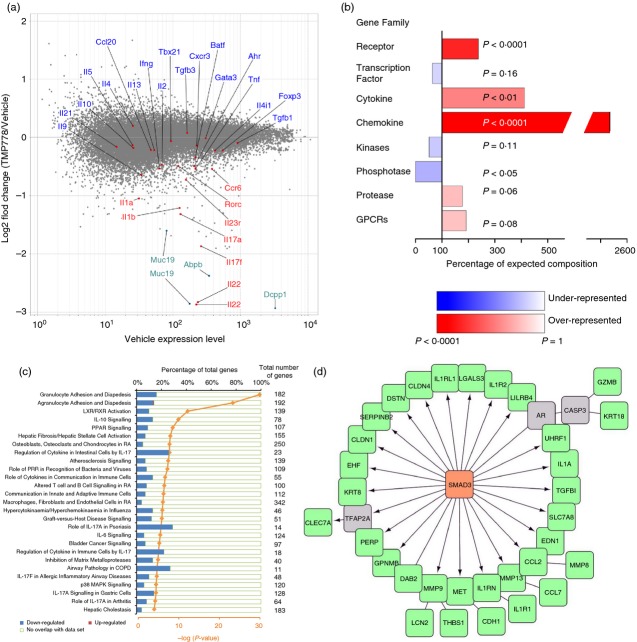
Figure 4.
The effect on genome-wide transcription by administration of retinoic acid receptor-related orphan nuclear receptor γt (RORγt) inverse agonist TMP778 in vivo. Total RNA from Fig.2(b) samples were used for microarray analysis using an affymetrix mouse gene 1.0 ST Array. Each RNA sample was the pool of four individual mouse RNA samples. (a) Data are shown as the log2-fold change of TMP778/vehicle versus the expression level, indicating genes increased or decreased by TMP778 treatment in vivo. Data shown are representative of microarray data of one RNA sample set (vehicle sample versus TMP778 sample) from two RNA sample sets. (b) Gene family signature enrichment. Genes up-regulated or down-regulated at least 1·5-fold with an expression level of 50 or greater were analysed. Each gene family enrichment is displayed as a percentage of the expected number of genes for a list of that size. When more genes than expected are found, the family is over-represented/enriched in the list (red bars). If the list contains fewer members of that family than expected, then that family is under-represented (blue bars). P-value is calculated using Fisher Exact Test and the value is used in colouring the bars (the more significant the P-value, the darker blue/red a bar is). All of the enriched genes in the figure happened to be down-regulated genes. (c) Canonical pathway analysis by ingenuity. Genes from (b) were analysed for their role in canonical pathways by IPA of ingenuity. Each canonical pathway has a different total number of genes as indicated. Pathways shown are the percentage of our down-regulated or up-regulated genes. Graphs were selected from data of which – log (P-value) is equal or higher than 4. P-value was also calculated using right-tailed Fisher Exact test. (d) Transcriptional factor enrichment analysis was conducted using IPA. The network model was reconstructed using the Advanced Network Analysis Tool (ANAT). SMAD3 was discovered by transcriptional factor enrichment analysis, the green nodes were genes down-regulated by TMP778 treatment, and the grey nodes were predicted genes connecting SMAD3. The arrow indicates direct regulation and the straight line indicates correlation between two nodes.

