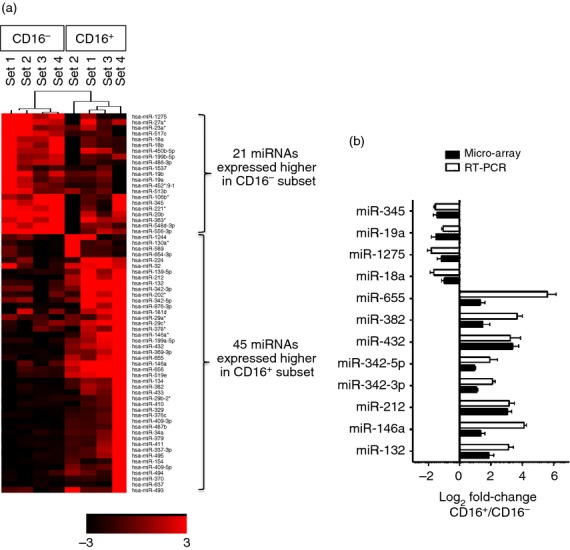
Figure 1.

Differentially expressed microRNAs (miRNAs) in CD16+ and CD16− monocytes. (a) Heat-map of expression intensity of differentially expressed (DE) miRNAs in CD16+ and CD16− monocytes from miRNA array data based on P ≤ 0·05 and fold-change ≥ 1·96 (log2 FC ≥ |0·97|). (b) Validation of 12 selected DE-miRs from miRNA array data by real-time PCR. RNU48 was used as a reference gene. Data shown are mean ± SEM of samples from at least three different individuals.
