
Figure 4.
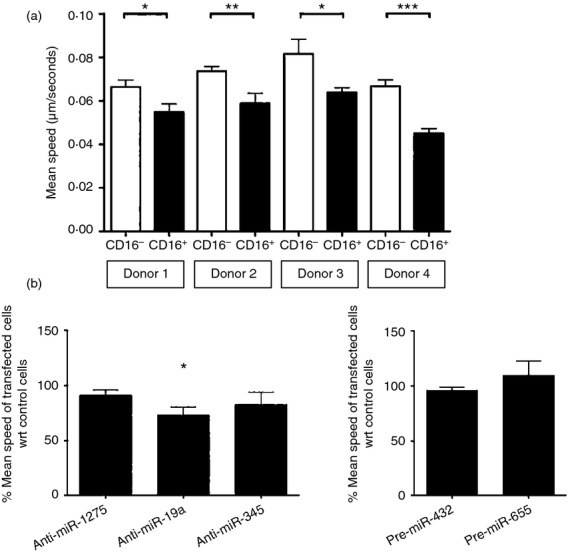
Effect of differentially expressed microRNAs (miRs) on regulating the motility of CD16+ monocytes. (a) Bar graph depicting the motility of freshly isolated monocyte subsets from four different donors that were plated in chamber slides, tracked using live cell imaging with motility quantified by amaris software. Mean speeds of at least 100 cells from each sample were shown. (b) Bar graphs showing the percentage ratio of the mean speed of the transfected cells. Isolated CD16− monocytes were transfected with 100 nm non-target anti-miR control, anti-miR-1275, anti-miR-19a or anti-miR-345 (left panel), or with 100 nm non-target pre-miR control, pre-miR-432 or pre-miR-655 (right panel) by electroporation. Twelve hours after transfection, random cell movement was tracked using live cell imaging with motility quantified by amaris software as in (a). Mean speeds of at least 30 cells in each sample were calculated. Percentage ratios were calculated using the mean speed of cell movement in pre-miRNA or anti-miRNA transfected cells over the mean speed of cell movement in non-target pre-miR or anti-miR control transfected cells, respectively. Data shown are mean ± SEM of samples from four different donors (left panel) and two different donors (right panel). *P < 0·05, **P < 0·01, ***P < 0·001.