
Figure 4.
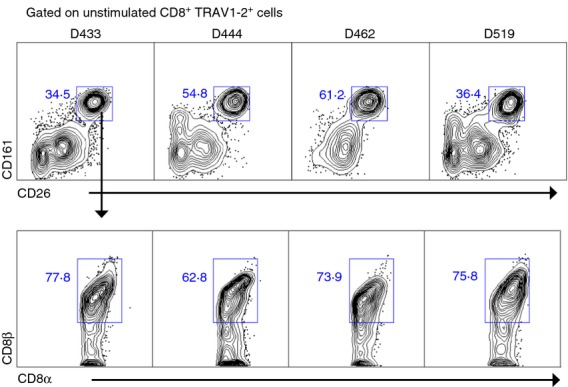
In healthy individuals high expression of CD26 or CD161 defines the same subset of CD8+ TRAV1–2+ cells that predominantly express the CD8αβ co-receptor. Expression of CD26 and CD161 on CD8α+ TRAV1–2+ cells from peripheral blood mononuclear cells of healthy individuals is shown (top row). The numbers represent the frequencies of CD8α+ TRAV1–2+ cells that co-express CD26hi and CD161hi (46 ± 13; n = 4). The bottom row represents CD8β expression (y-axis) from the CD8α+ TRAV1–2+ CD26hi CD161hi gated cells from the top row. The numbers in the plot represent the frequency of CD8α+ TRAV1–2+ CD26hi CD161hi that co-express CD8β (72·6 ± 6·7; n = 4).