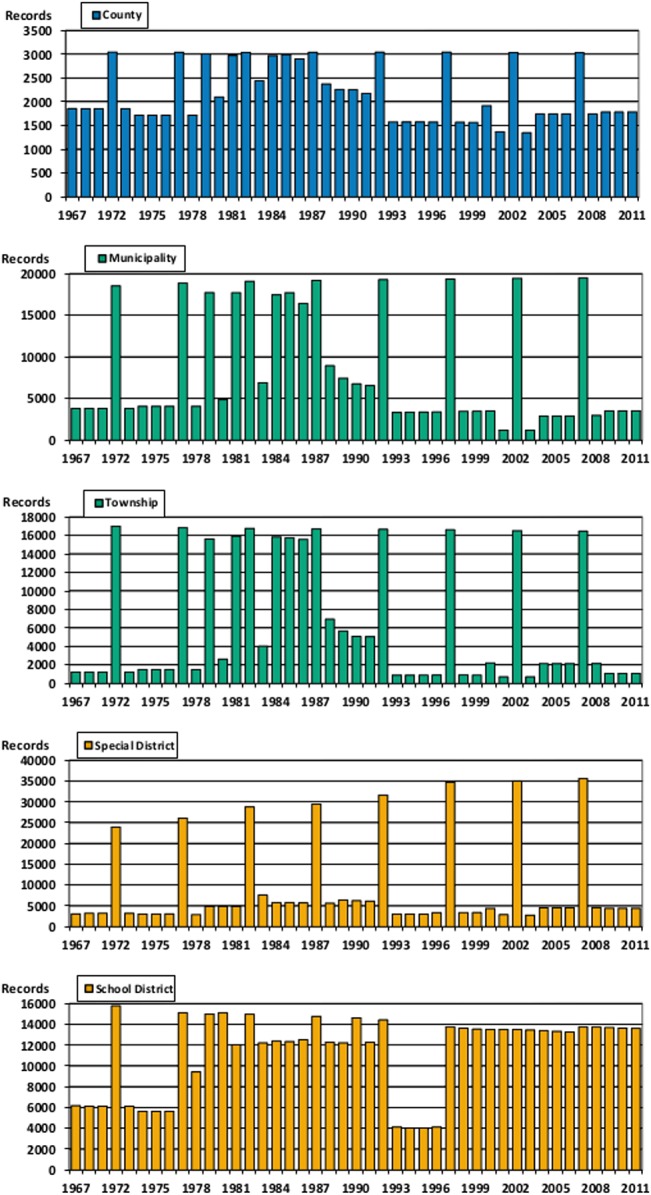
Fig 1. Report Counts by Government Type.

This figure shows five bar graphs. One for each of counties, municipalities, townships, special districts, and school districts showing the number of records for each government type that exist in each year of the data.
