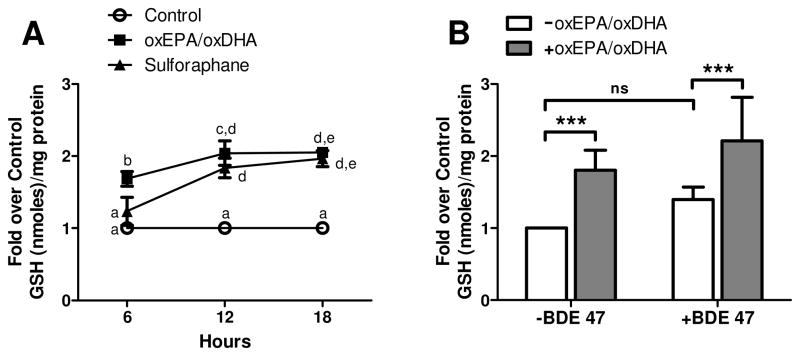
Figure 1. Effect of oxEPA/oxDHA and BDE 47 on GSH status.
(A) Induction of GSH was measured in HepG2 cells exposed to a 1.5/1 mixture of oxEPA/oxDHA (60 μM oxEPA/40 μM oxDHA), sulforaphane (SFN, 40 μM), or equal volume of DMSO (vehicle control). Alphabetical letters are used to indicate statistically significant differences between means at p≤0.05. Letters shared in common between or among the groups indicate no significant difference at p>0.05. (B) GSH status in cells pretreated with oxEPA/oxDHA (or DMSO, denoted as “-oxEPA/oxDHA in figure legend) for 12 h, prior to exposure to 100 μM BDE 47 (or DMSO, denoted as “-BDE 47” in figure legend) for 24 h. ***p≤0.001 relative to corresponding controls. Data are expressed as fold over control values and are means ± SEM of n=3 experiments.

