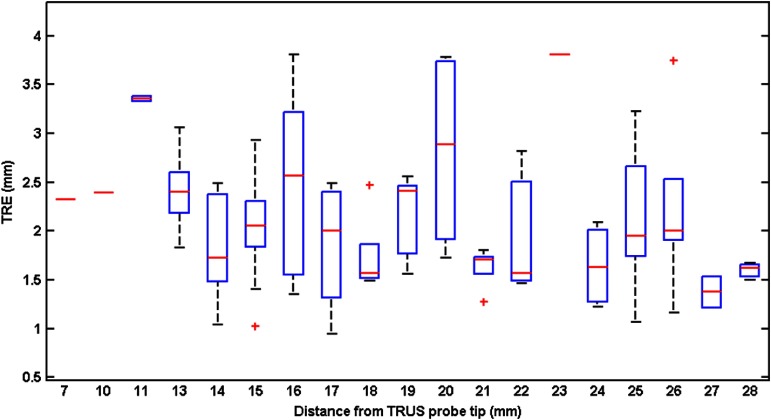
Fig. 9.
Plots of the spatial distribution of TREs: the TREs are plotted against the Euclidean distance (mm) from the TRUS probe tip with distance bin range of 1 mm. The central red marks are the medians; the edges of the boxes show the 25th and 75th percentiles; the whiskers extend to the most extreme data points not considered outliers; the one outlier is plotted as a plus sign individually; and the distance bin with only one fiducial is plotted as a red dash.

