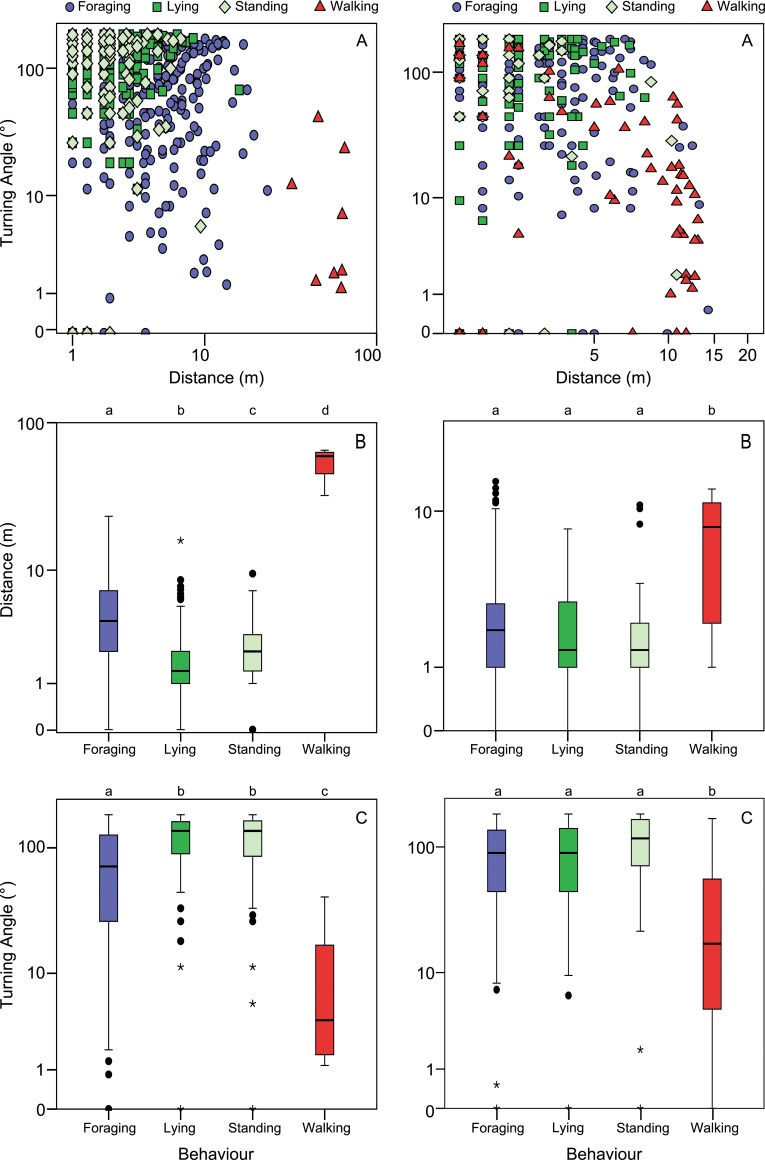
Fig 2. Turning angles and distances per behaviour type in the forest for the 1 min and 12 s interval.
Distribution of turning angles and distances for the data from the 1 min (left) and 2 s (right) interval of cows in the forest for each of the four dominant types of behaviour. A) Relationship between distance and turning angle on a logarithmic scale. B, C) Boxplots showing the distribution of both distances and turning angles. Letters on top of the graphs depict if there are significant differences for these movement metrics among the groups (permutation ANOVA).

