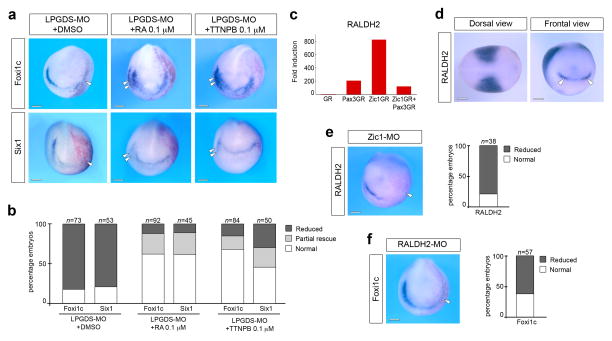
Figure 4. Retinoic acid signaling regulates placode formation.
(a) Treatment at stage 11 of LPGDS-depleted embryos (LPGDS-MO) with 0.1 μM RA or with the RA receptor agonist, TTNPB, restored completely or partially Foxi1c and Six1 expression on the injected side. Frontal views, dorsal to top. Injected side is indicated by the lineage tracer (Red-Gal). Double arrowheads indicate Foxi1c or Six1 expansion on the control side. (b) Quantification of the rescue experiment. Four independent experiments were performed. The number of embryos analyzed for each condition (n) is indicated on the top of each bar. DMSO vs. RA or TTNPB treated embryos (p< 0.001, Fisher exact test) RA vs. TTNPB treated embryos show no significant differences. (c) Fold induction of RALDH2 from the microarray data. (d) By in situ hybridization RALDH2 is detected in the trunk mesoderm (dorsal view, anterior to right) and at the anterior neural plate (frontal view; arrowheads). (e) RALDH2 expression is lost in Zic1-depleted embryos. The graph is a quantification of the results. Three independent experiments were performed. The number of embryos analyzed (n) is indicated on the top of each bar. (f) Foxi1c expression is reduced in RALDH2-MO injected embryos. The graph is a quantification of the results. Three independent experiments were performed. The number of embryos analyzed (n) is indicated on the top of each bar. (e–f) Arrowheads indicate reduced expression on the injected side. Scale bars, 200 μm.

