
Fig 2. Noise stimuli.
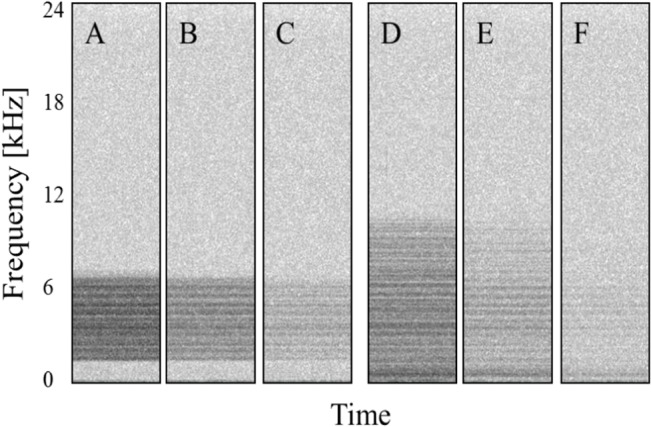
Spectrograms (1024 point Hamming window, 75% overlap, 11.7 Hz frequency resolution) of noise playback stimuli recorded during trials. Treatments A–C had a bandwidth of 5 kHz. Treatments D–F had a 10 kHz bandwidth. Harmonic structure is due to frequency response of the playback system.