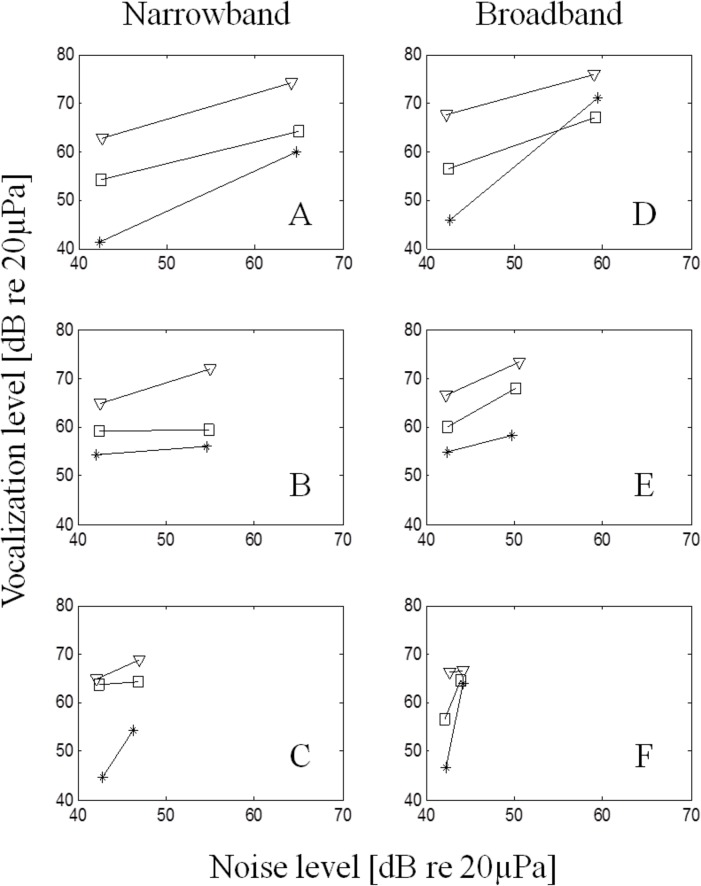
Fig 4. Average CLC source levels vs. noise level for all 6 noise bandwidth/level combinations.
Treatments A, B, and C had 5 kHz bandwidth; treatments D, E, and F had 10 kHz bandwidth. The top, middle, and bottom rows indicate high, medium, and low noise amplitudes, respectively. Panels are arranged by noise level (rows) and bandwidth (columns). Triangles, squares, and stars represent Mulva, Jerry, and Bart, respectively. Note that call source level never decreases between control (42 dB re 20 μPa noise level) and treatment trials.

