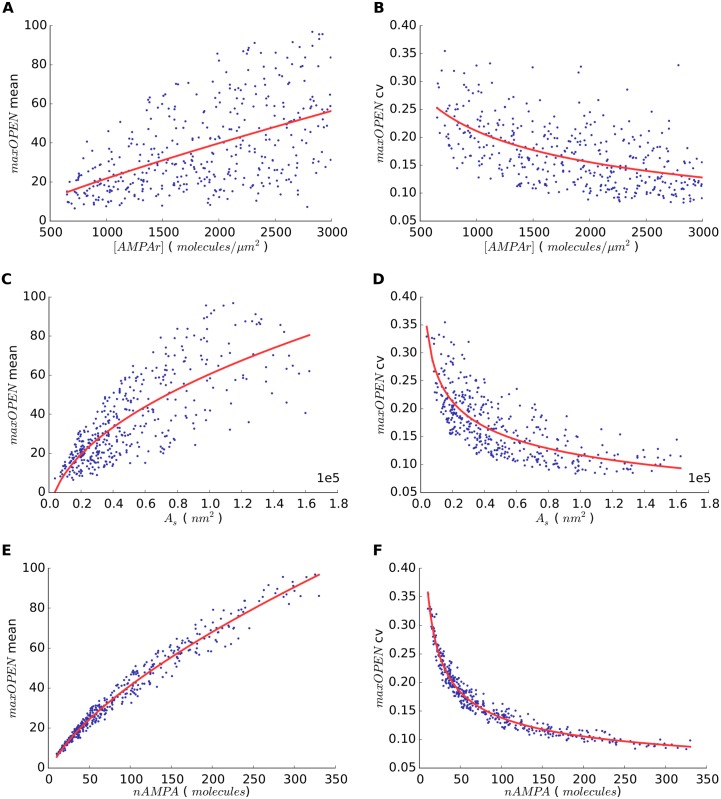
Fig 3. Relationship between synapse model parameters and open AMPA receptors.
(a) Relationship between the AMPA concentration [AMPAr] in the model synapse and the maximum number of open AMPA receptors (maxOPEN) after the release of glutamate. Each point represents the mean of 500 simulations with different random seeds. (b) Relationship between [AMPAr] in model synapses and the coefficient of variation of maxOPEN. (c) and (d) show analogous values for synapse area A s. (e) and (f) use the total number of AMPA receptors nAMPA as base variable. The associated regression curves (red) have been represented for each dataset.

