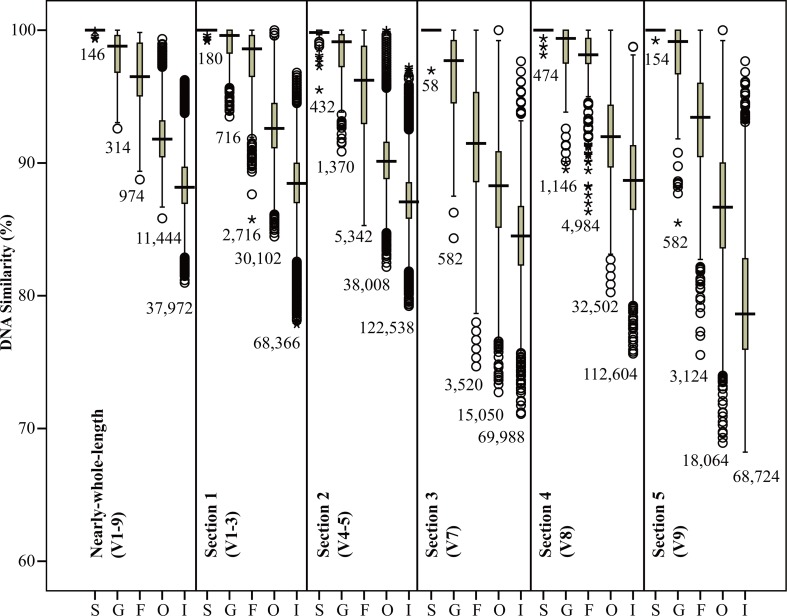
Fig 3. The boxplot distribution of sequence similarities for different 18S rRNA gene regions in the intra-species (S), inter-species but intra-genus (G), inter-genus but intra-family (F), inter-family but intra-order (O), and inter-order (I) categories.
The central boxes represent the middle three quarters of the data. The total number of samples in each plot is listed at the bottom of each box.

