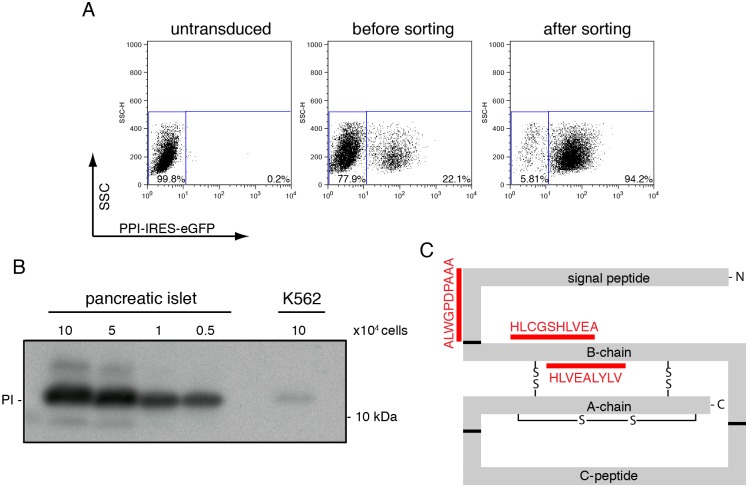
Fig 2. Generation of preproinsulin expressing K562 cells.
(A) K562 cells were retrovirally transduced to express preproinsulin-IRES-GFP and sorted for the GFP positive population. Flow cytometry analysis of wild-type preproinsulin-expressing cells before transduction (left panel), after retroviral transduction but before sorting (middle panel) and after sorting (right panel). Sorting yielded a cell population that was approximately 95% GFP positive. (B) Human pancreatic islets cells and preproinsulin-expressing K562 cells were lysed and proteins were separated on 12% Nu-PAGE. Proinsulin levels were analyzed by Western blot. The number of cells used to prepare the lysates is indicated. (C) Schematic representation of the preproinsulin molecule including the three disulfide bonds. The epitopes eluted from MHC class I molecules are depicted in red.

