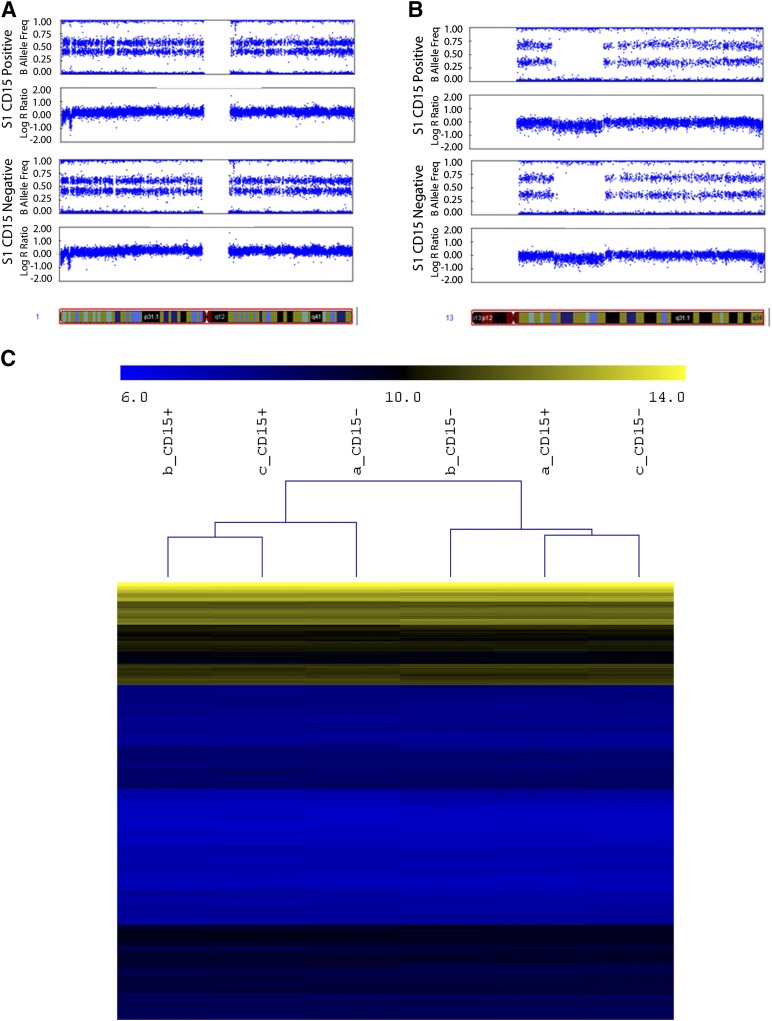
Figure 2.
CD15-positive (CD15+) and CD15-negative (CD15−) cells do not have significantly different cytogenetic or gene expression profiles. Both CD15+ and CD15− cells from the S1 cell line have indistinguishable cytogenetic profile. Single-nucleotide polymorphism array results shown by B allele frequency and log R ratio for two example chromosomes. Chromosome 1 (A) and 13 (B). (C): Hierarchical clustering of genes from CD15+ and CD15− cells from the S1 cell line, demonstrated with gene expression array.

