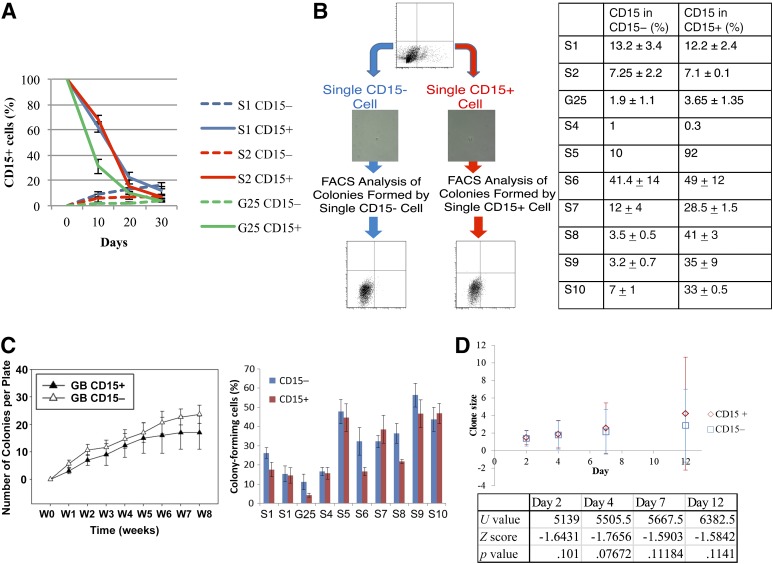
Figure 4.
CD15-positive (CD15+) and CD15-negative (CD15−) populations from glioblastoma (GB) sorted by fluorescence-activated cell sorting (FACs) established a phenotypic equilibrium that recapitulated the original GB cell line phenotype. (A): The proportion of CD15+ cells in a population of GB cells over time, the initial populations were sorted by FACS as CD15+ and CD15−. (B): Single CD15+ and CD15− cells were sorted into 96-well plates and allowed to proliferate for at least 6 weeks, after which CD15 expression was analyzed by FACS. The table shows the results of this experiment in 10 tumor-initiating cell lines. (C): Colony-forming ability of single CD15+ and CD15− cells from 10 GB cell lines after an 8-week time course. (D): Average clone size with error bars showing standard deviation of the data set. The variety of clone sizes was wide at each time point. The table shows the results of Mann-Whitney values at each time point. Abbreviations: FACS, fluorescence-activated cell sorting; GB, glioblastoma; W, week.

