Figure 2.
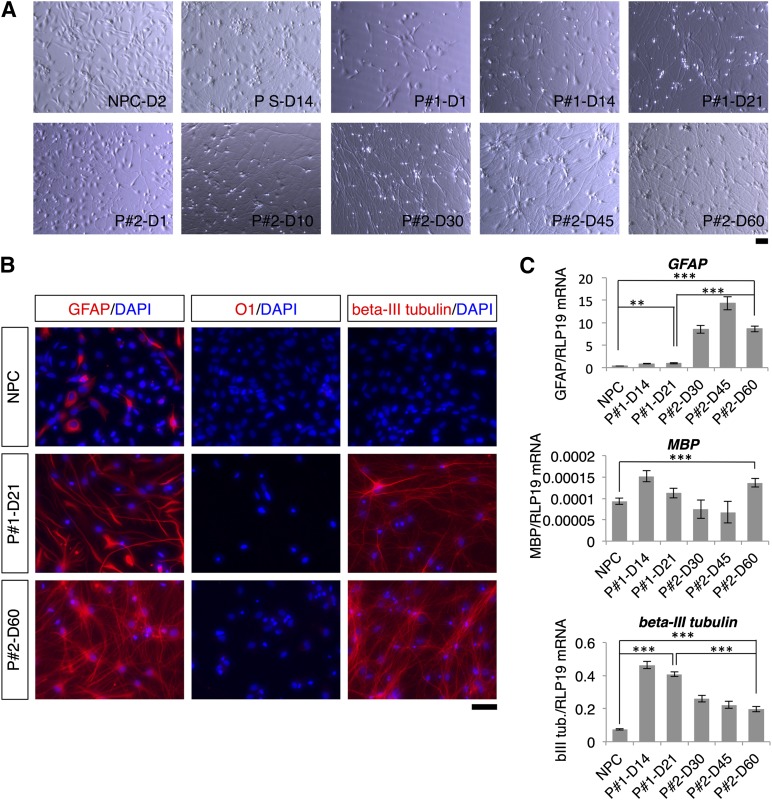
Morphological changes and postdifferentiation distribution of neurons, astrocytes, and oligodendrocytes produced by the two- and three-step protocols. (A): Morphological changes of cells during differentiation in the two- and three-step protocols and in the spontaneous differentiation protocol. NPCs used as starting cells in the two differentiation protocols are shown for comparison. (B): GFAP, O1, and β-III tubulin immunostaining at the beginning and the end of the differentiation protocols. (C): Quantitative reverse transcriptase-polymerase chain reaction analysis of GFAP, MBP, and β-III tubulin expression on different days of the differentiation protocols. Levels of statistical significance were set at ∗∗, p < .01 and ∗∗∗, p < .001. The scale bars correspond to 50 μm on the specimen level. Abbreviations: D, day; DAPI, 4′,6-diamidino-2-phenylindole; NPC, neural progenitor cell; P1, two-step protocol; P2, three-step protocol; PS, spontaneous differentiation protocol.

