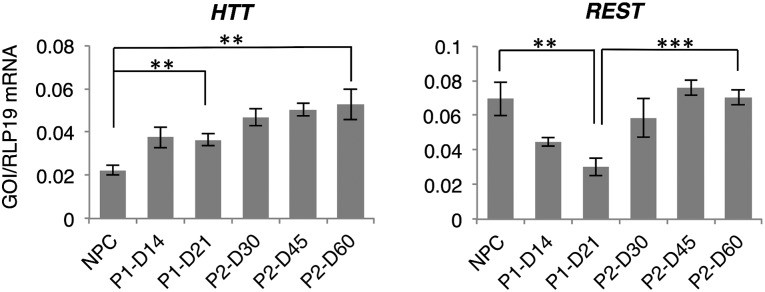
Figure 5.

Gene expression of Huntington’s disease-related genes. Quantitative reverse transcriptase-polymerase chain reaction analysis was used to measure expression of HTT and REST/NRSF during differentiation in the two- and three-step protocols. Levels of statistical significance were set at ∗∗, p < .01 and ∗∗∗, p < .001. Abbreviations: D, day; NPC, neural progenitor cell; P1, two-step protocol; P2, three-step protocol.
