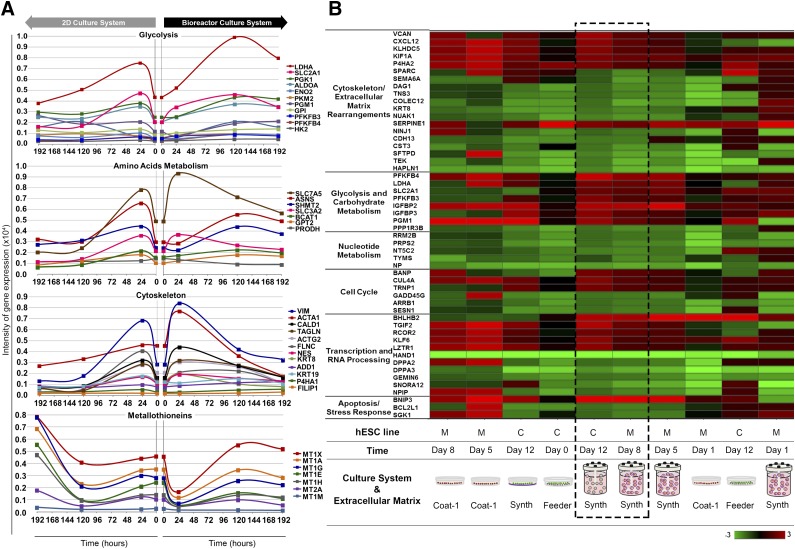
Figure 4.
Whole-genome transcriptome analysis of hESCs expanded on Synthemax II polystyrene microcarriers. (A): Transcriptional profiling of selected genes with dynamically changing expression over culture time. hESC-M cells in the 2D culture system (left) versus the bioreactor culture system (right) of glycolysis, amino acid metabolism, cytoskeleton rearrangements, and metallothionein genes. Genes were considered dynamically changing for coefficient of variation CV ≥20% over the 192 hours of culture. A complete list of all genes with CV ≥20% can be found in supplemental online file SFA. A list of the genes composing this figure, fold-change values, CV statistics, and gene abbreviation definitions is provided in supplemental online file SFB. (B): Heat map of converging genes in both hESC lines across significantly enriched pathways given by Ingenuity Pathway Analysis. Heat map of probes with transcriptional convergence during the expansion process. Color gradient indicates gene expression fold-change between the referred samples and “hESC-M day 0.” Dashed box highlights the similarity of gene expression patterns between hESC-C and hESC-M cells by the end of expansion process in Synthemax II polystyrene microcarriers. A complete list of the genes composing this figure, expression values, fold-change, and gene abbreviation definitions can be found in supplemental online file SFD. The microarray dataset presented in this figure was submitted to the Gene Expression Omnibus repository with the accession number GSE63192. Abbreviations: 2D, two-dimensional; C, hESC-C cell line; hESC, human embryonic stem cell; M, hESC-M cell line.

