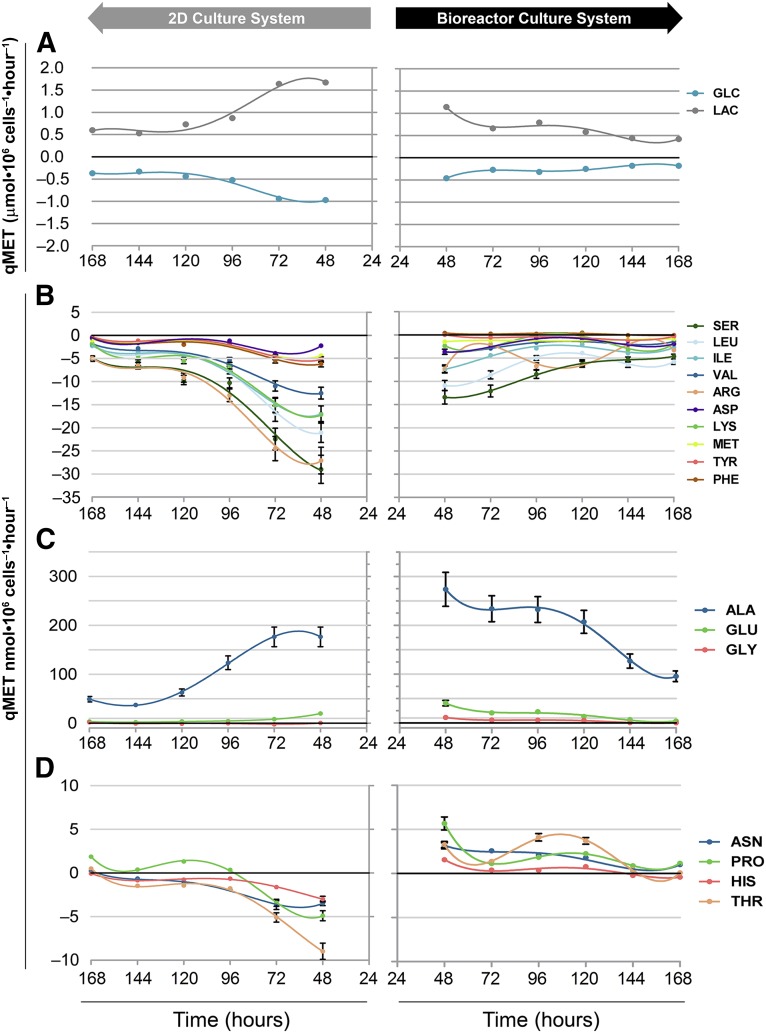
Figure 5.
Metabolic profiling of hESC-M in the 2D culture system versus stirred-tank bioreactors. hESC-M cells in the 2D culture system (left-sided charts) and the bioreactor culture system (right). (A): Specific rates of glucose consumption and lactate production. Specific amino acid uptake/production rates of group 1, consumed amino acids (B); group 2, produced amino acids (C); and group 3, amino acids with inverted uptake/production profiles (D). For specific rates, negative values denote uptake and positive values denote production. Error bars represent the propagation of error. The curves represent the best fit to points using the fourth order polynomial. Abbreviation: 2D, two-dimensional.

