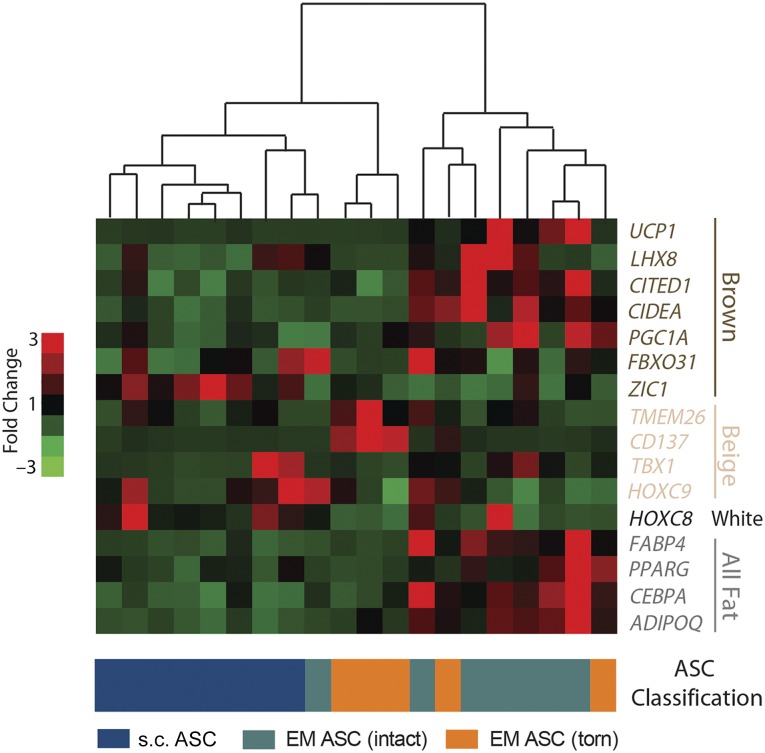
Figure 3.
Activated EM ASCs cluster according to tear state across adipose genes. Expression of a panel of brown, beige, white, and all fat genes in isoproterenol-activated ASC cultures is shown in a heat map, with red colors indicating high expression and green colors indicating low expression. Hierarchical clustering (centroid linkage) is shown above the heat map, and the sample classification is shown below. Abbreviations: ASC, adipose-derived stem cell; EM, epimuscular.

