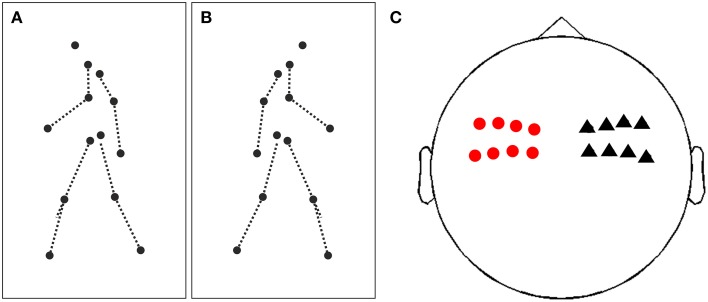
Figure 1.
Illustration of stimuli and sensors of interest. (A) Illustration of a single frame of a point-light display (PLD) facing and walking to the left. PLDs are represented by 13 black dots, dashed lines are only for illustration and not present in the movies. (B) Same as (A), but now a PLD walking and facing to the right. (C) Illustration of sensors of interest for time-frequency analysis and subsequent analysis of lateralization effect. Red circles represent 8 sensors in the left hemisphere, black triangles 8 sensors in the right hemisphere, covering bilateral (pre)motor areas.

