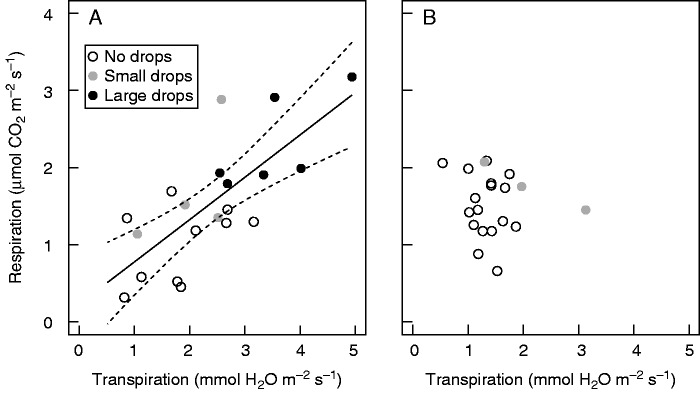
Fig. 4.

The relationship between the night-time rates of respiration and transpiration in (A) non-flowering and (B) flowering Rhinanthus alectorolophus. Each circle relates to one individual plant. The size of drops observed on the leaves of examined plants immediately before the physiological measurement is indicated in the key. Linear regression (r2 = 0·55, F1,18 = 22·31, P < 0·001) and the 95 % confidence interval are presented by solid and dashed lines, respectively. No large drops were observed on the leaves of flowering plants.
