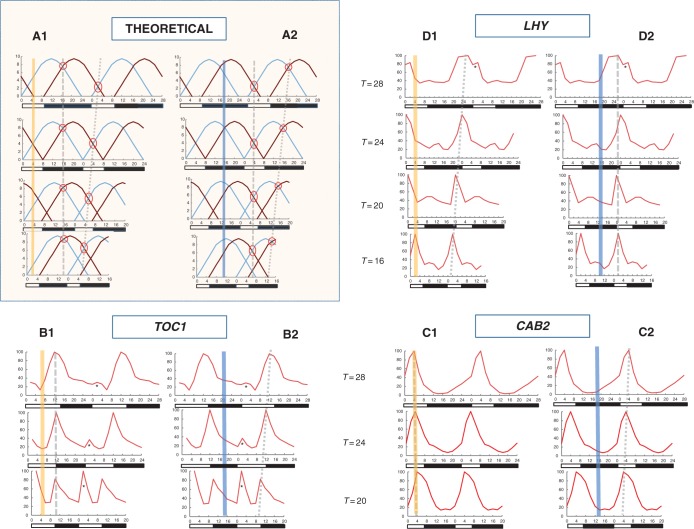
Fig. 3.
Predicted (theoretical) timing of the day calibrator and night calibrator compared with the observed timing of TOC1, CAB2 and LHY phases in T cycles. In the theoretical model (A), the dawn signal (blue line) and the dusk signal (brown line) are re-timed when sunrise and sunset are shifted in various T cycles; the signal arcs are otherwise unaltered. In the process, the day calibrator (marked by an oval) maintains a constant time interval from midnight (panel A2), but not from noon, whereas the night calibrator (marked by a circle) maintains a constant time interval from noon (panel A1), but not from midnight. Observations of gene expression in T cycles (B to D) show that TOC1 is expressed at a constant time interval from noon (panel B1), CAB2 is expressed at noon (panel C1), while LHY is expressed at a constant time interval from midnight (panel D2) across all T cycles. [Besides their regulation by the solar clock, TOC1 and LHY also show activity spikes induced by the dark-to-light transition at sunrise (asterisks). The TOC1 spikes become more marked as the cycle period shortens.] The x-axes show zeitgeber time. Vertical bands indicate noon or midnight. Black and white bars below the x-axes denote dark and light periods respectively. A constant time interval across all T cycles between a calibration marker or gene expression peak and either noon or midnight is denoted by a dashed line, while a dotted line denotes dissimilar time intervals. Readings for each curve were taken at intervals of 2 h and are normalized by assigning a value of 100 for the highest reading. Details of photoperiods and cycle periods are given in Table 1.

