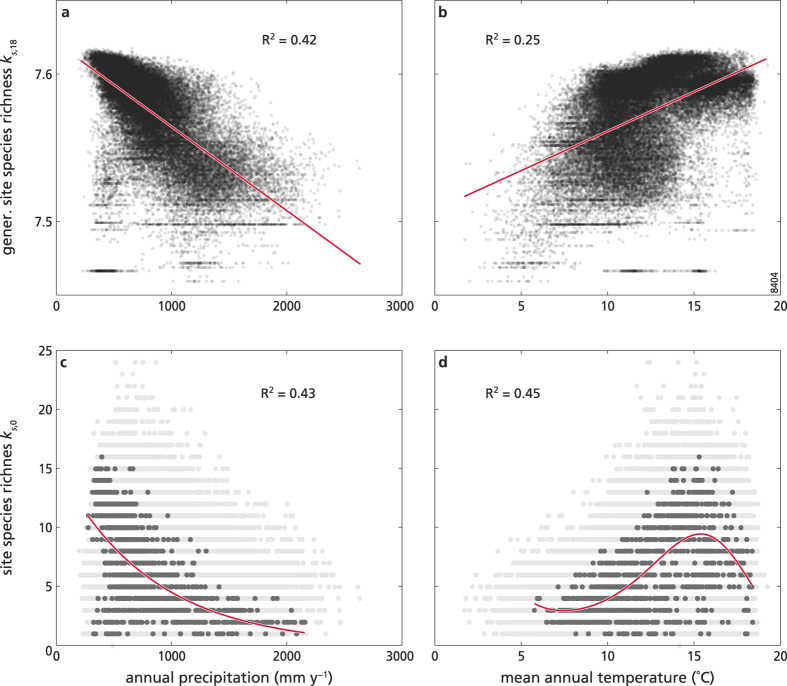
Figure 5. SFI site species richness versus climate. Each dot represents a site reflection as a function of site annual precipitation (mm y−1, left panels) and site mean annual temperature (°C, right panels).
The top panels (a,b) show generalized site species richness ks,18, and the selected models (continuous line; linear for both). The bottom panels (c,d) show species richness of the “typical” sites (black dots), i.e. sites selected according to their small (<1%) change in ranking when going from low (ks,0) to high (ks,18) reflections, with the continuous line representing the selected model (c: linear, d: cubic). For comparison (in c and d), the species richness ks,0 of all the other (“non-typical”) sites is also reported (grey dots; same as in Fig. 1a,b). See Supplementary Table S3 for details on model selection.

