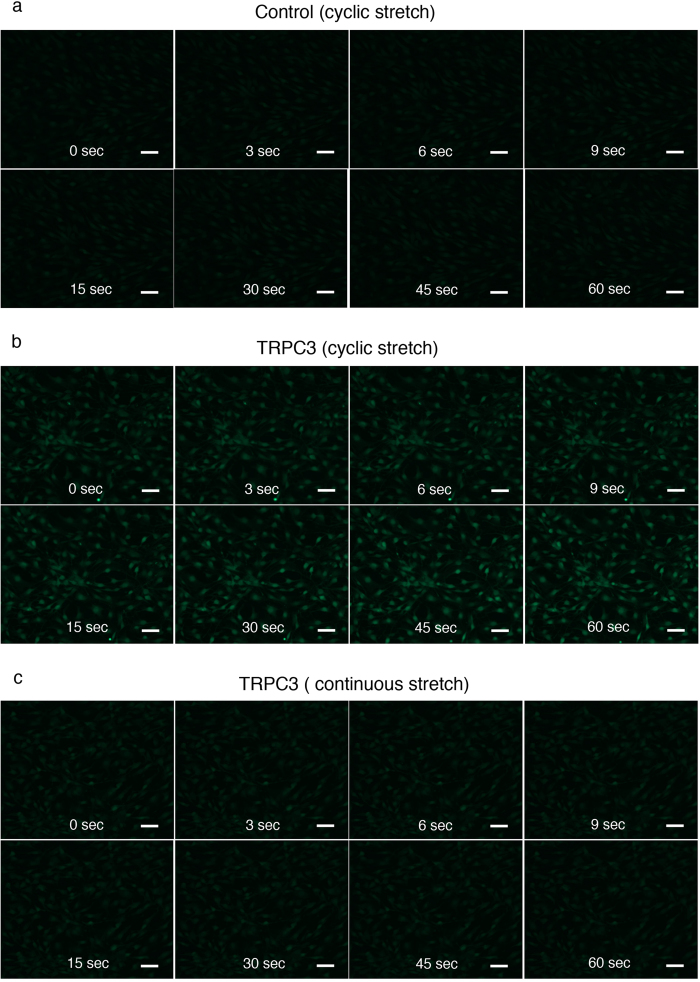
Figure 6. Real-time calcium imaging of TRPC3 overexpressing fibroblasts and control fibroblasts during mechanical stretching.
Live imaging of calcium influx in fibroblasts was obtained as described in the Materials and Methods section. Scale bars for each images = 50 μm. a; Control fibroblasts showed a weak increase in fluorescence upon repetitive mechanical stretching. b; TRPC3 overexpressing fibroblasts exhibited increased fluorescence upon repetitive mechanical stretching. The increased fluorescence continued throughout the period in which they were stretched. c; When TRPC3 overexpressing fibroblasts were stretched once and then held in a stationary position, the fluorescence decreased over time.

