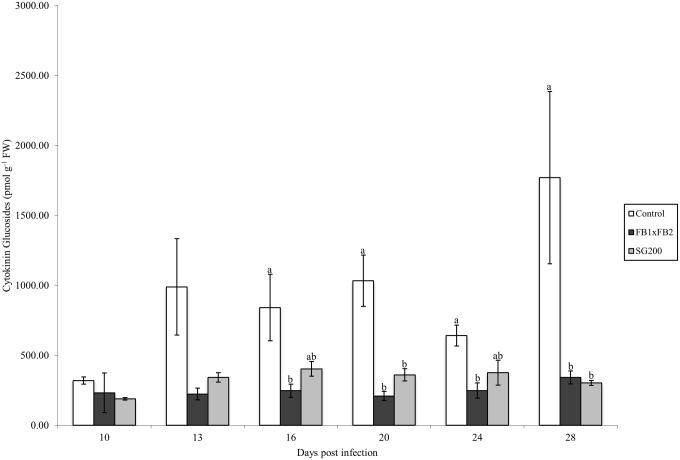
Fig 4. Total CK glucoside concentration (pmol g -1 FW) for control, dikaryon and solopathogen injected cob tissue at specific days post infection (dpi).
n = 2–15, error bars represent standard error (SE). Letters denote significant differences within time points (ANOVA and Tukey-Kramer post hoc analysis, p<0.05).

