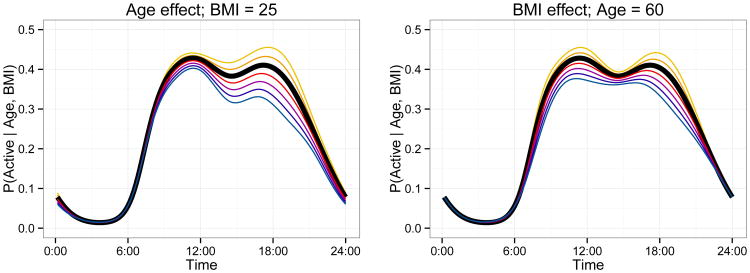
Figure 3.
The left panel shows the effect on the probability of being active of varying age in 5 year increments from 50 to 80 as a decreasing sequence of functions, while keeping BMI fixed at 25. The right panel shows the effect of varying BMI in 2.5 unit increments from 20 to 35 as a decreasing sequence of functions, while keeping age fixed at 60. In both panels, the subject- and subject-day-specific effects are set to zero. This figure appears in color in the electronic version of this article. An interactive version of this graphic appears on the first author's webpage.

