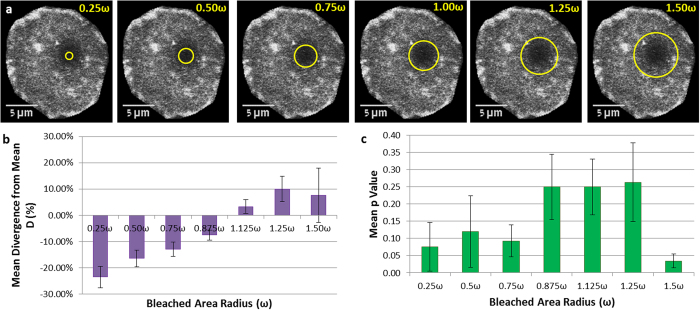
Figure 5.
Effects of Selected Monitored Area on D (a) Images showing the different radii of selection circles, from 0.25 ω to 1.5 ω overlaid on the bleached area. (b) Mean Divergence of D as a function of selected monitored area radius (0.25 ω–1.5 ω). The calculated diffusion coefficient deviates by 10% to 20% from the value for “correct” choice of the area (radius = ω) for a range of ~0.25 ω < r < ~1.50 ω. (c) However, the deviations for the range ~0.85 ω < r < ~1.25 ω are statistically insignificant (p > 0.1), constituting a “safe” space for user errors. Error bars represent SEM.

