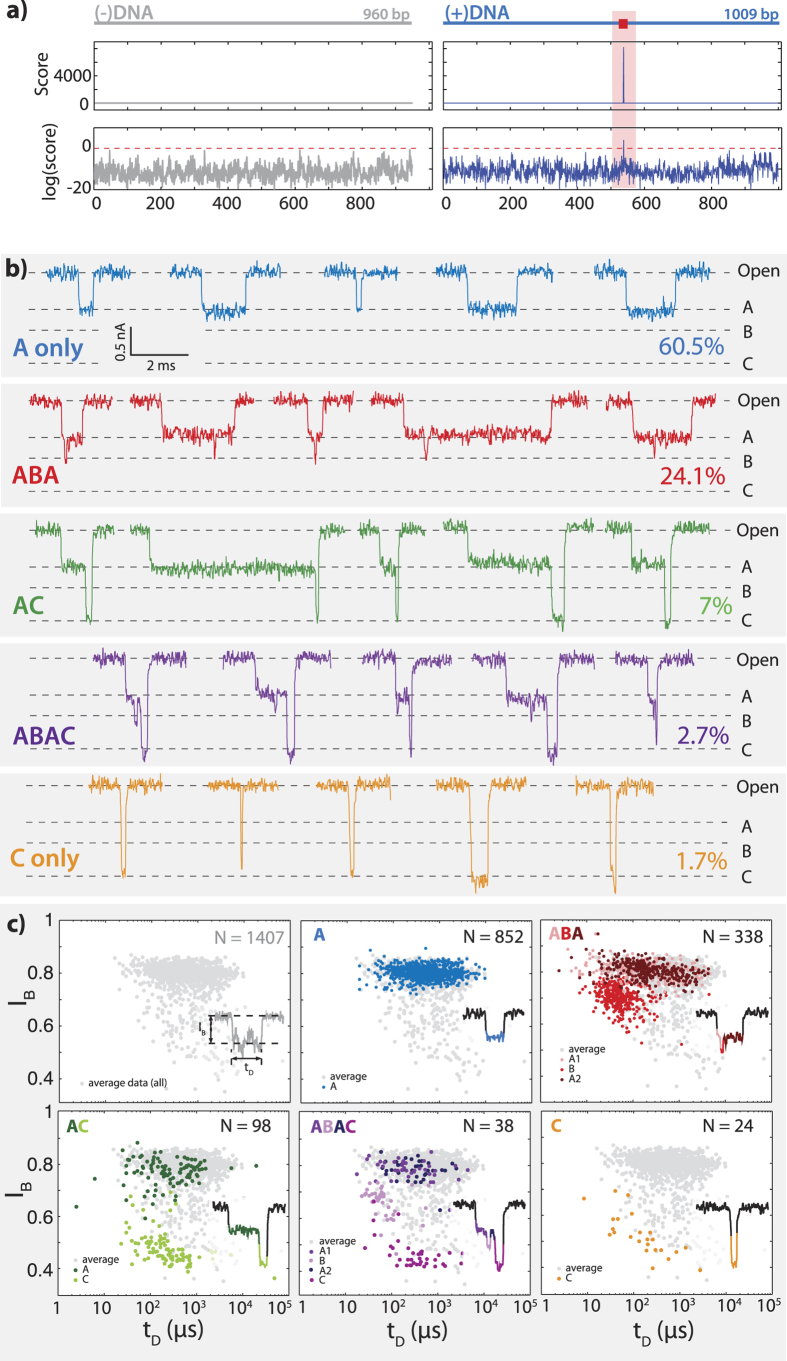
Figure 3. Blockage level patterns for zif268 + DNA in a thinned nanopore.
a) DNA samples for binding: (−)DNA contains no binding sites and (+)DNA contains one centered binding site (red square), as identified by scoring the sequences according to a zif268 position weight matrix (see Supplementary Information for details, Table S1). b) DNA sample events showing all observed blockage sublevel patterns: A, ABA, AC, ABAC, and C. c) Scatter plots showing event average depth IB and duration tD (gray) as compared to sublevel depth IBi and duration tDi (by color, as indicated on inset sample events). To facilitate visualization of population density, a random white noise offset below the acquisition rate of this data (−2 < ∆t < + 2 μs, acquisition rate 250 kHz) has been added to the duration of each blockage level in the event diagram.

