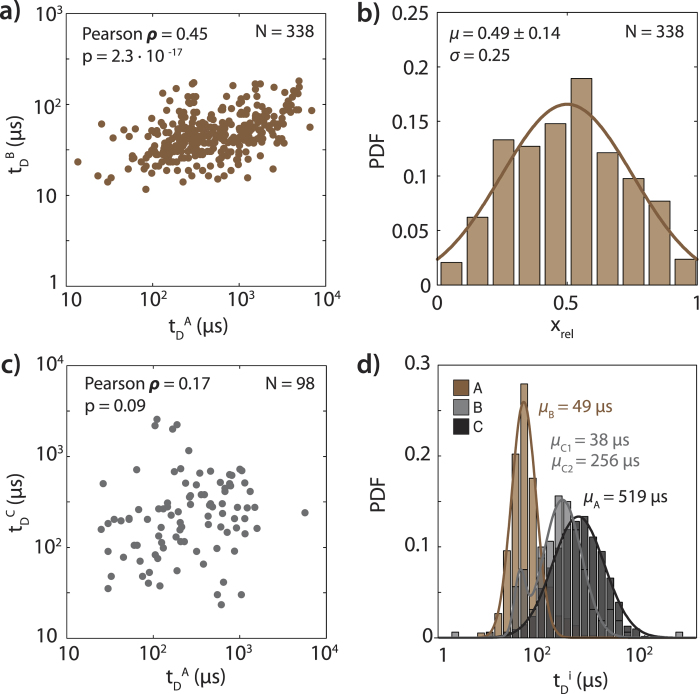
Figure 5. Timing of A, B, and C sublevels.
a) Correlation of B level duration to total A level duration in ABA events (Pearson ρ = 0.45 correlation, with significant p = 2.3×10⁻¹⁷). b) Distribution of observed relative position xrel of the B level within ABA events with Gaussian fit, N = 338. c) Correlation of C level duration to A level duration in AC events (Pearson ρ = 0.17 correlation, with non-significant p = 0.09). d) Distribution of observed durations of A, B, and C levels from all classifiable blockage level patterns observed.

