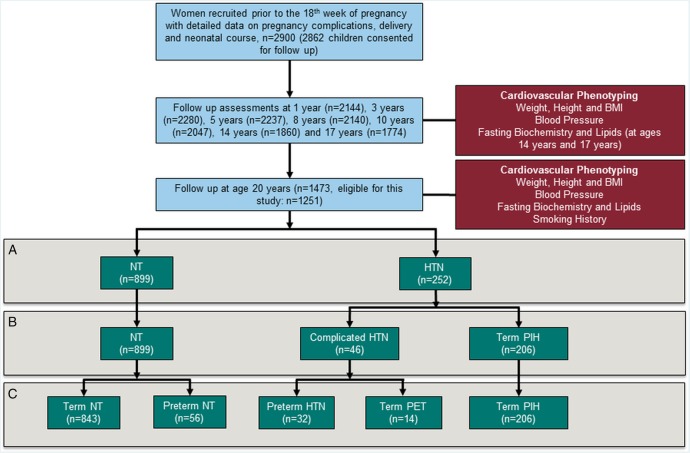
Figure 1.
Flow diagram to demonstrate recruitment and follow-up of participants from birth to age 20 (blue boxes) with measurements performed (red boxes). Comparisons were performed between groups stratified by maternal pregnancy hypertension history. Initially, all those whose mother developed hypertension were compared to those with normotensive mothers (A) and then pregnancy hypertension severity investigated (B). Finally, impacts of other pregnancy-related factors linked to cardiovascular risk, in particular preterm birth (C).

