
Figure 1. Expression distribution of the chemosensory receptors in the zebrafish OM.
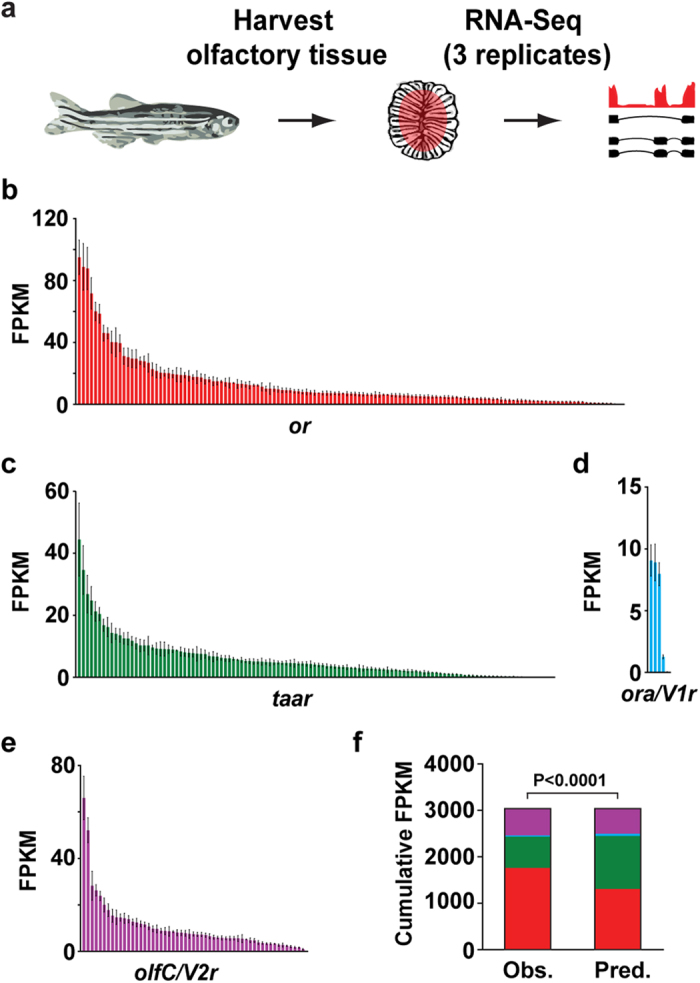
(a) RNA-Seq experimental strategy. After dissecting the olfactory mucosa (OM) of adult male zebrafish, RNA was extracted, cDNA generated, and libraries for deep-sequencing amplified. The libraries were then sequenced on a HiSeq2500 with 100 bp paired-end reads. (b–e) Distribution of mean FPKM expression values for each of the or (red), taar (green), ora/V1r (blue) and olfC/V2r (purple) genes in the zebrafish OM. Genes are displayed in descending order of their mean expression values. The error bars represent the standard error of the mean (SEM) from 3 sample replicates (each containing pooled OM from 4–5 adult male zebrafish). (f) The observed relative expression of each chemosensory receptor gene family differs from a predicted model where each receptor gene is expressed equally (χ2, P < 0.0001). or genes in red, taar genes in green, ora/V1r genes in blue, and olfC/V2r genes in purple.