
Figure 2. Chemosensory receptor gene expression correlates with number of neurons in zebrafish OM.
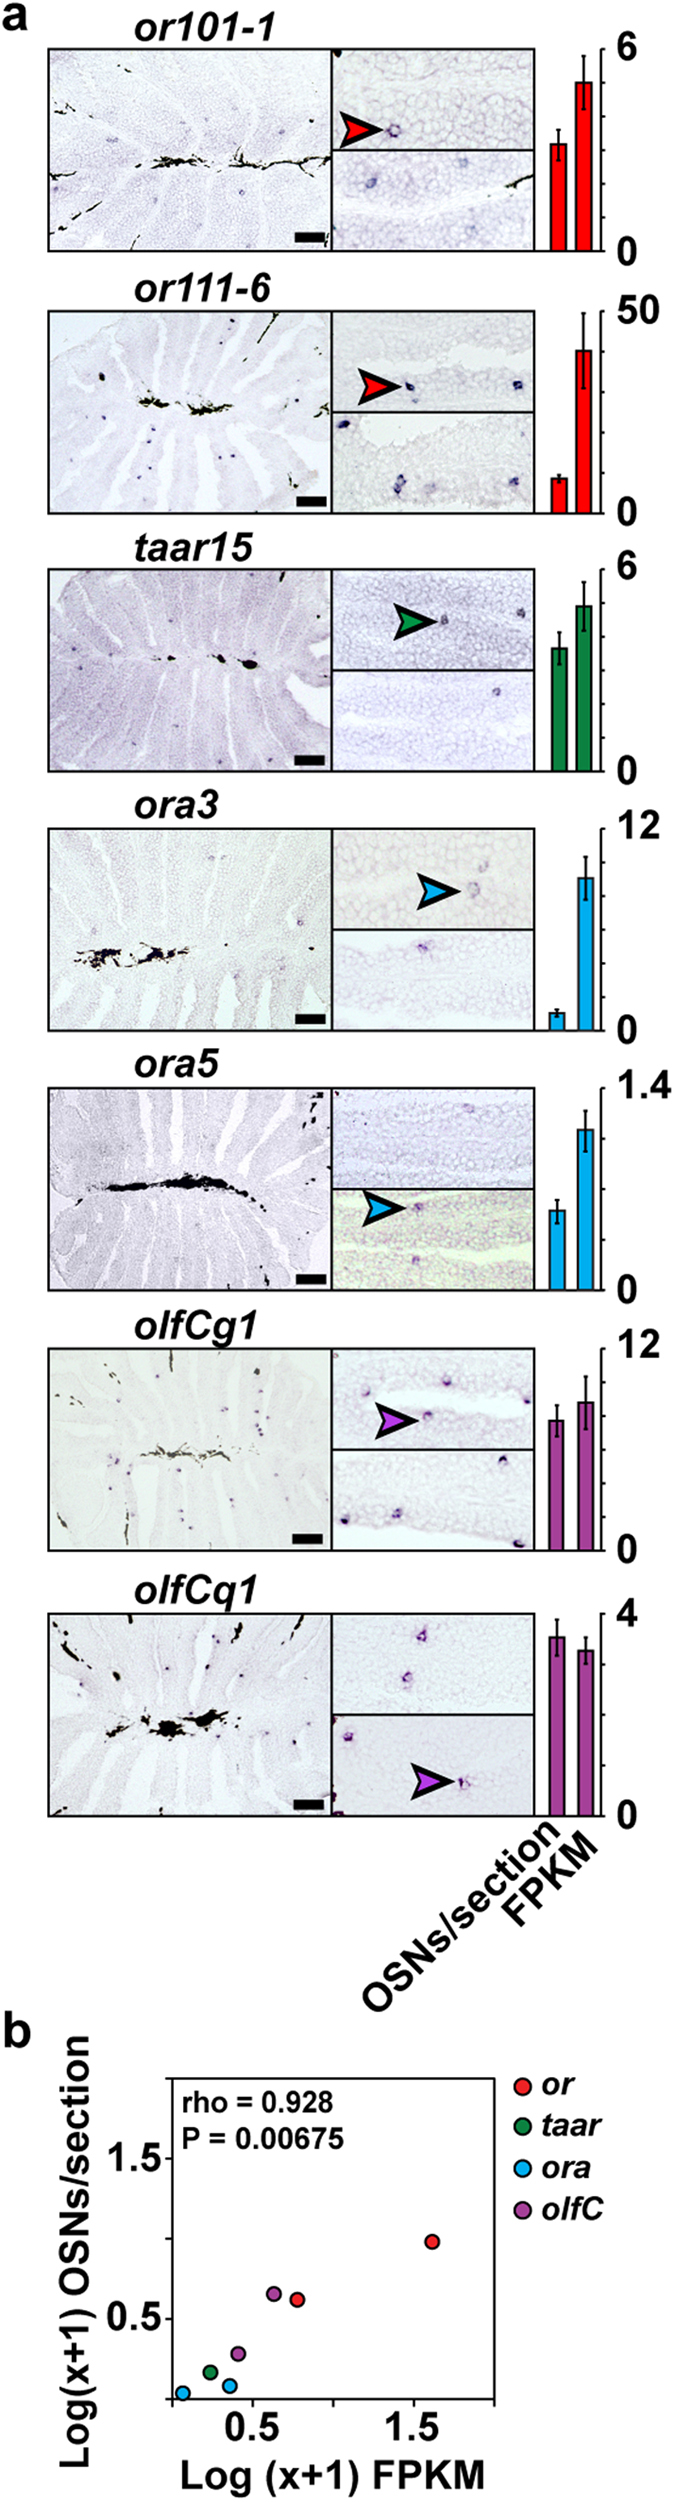
(a) Cryosections of adult zebrafish OM were hybridized with cRNA probes for or101-1, or111-6, taar15, ora3, ora5, olfCg1, olfCq1. Representative micrographs show expression in complete sections (left panel), and single lamella (right panels). The hybridization signal was observed in sparse cells within the sensory region of the OM. Arrowheads point to labeled OSNs. To the right of each micrograph a bar graph shows number of labeled OSNs/section (mean +/− SEM, n = 47–72), and the corresponding RNA-seq expression values (mean +/− SEM, n = 3). (b) Spearman correlation of FPKM values and OSN density determined by ISH. Scale bars, 50 μm.