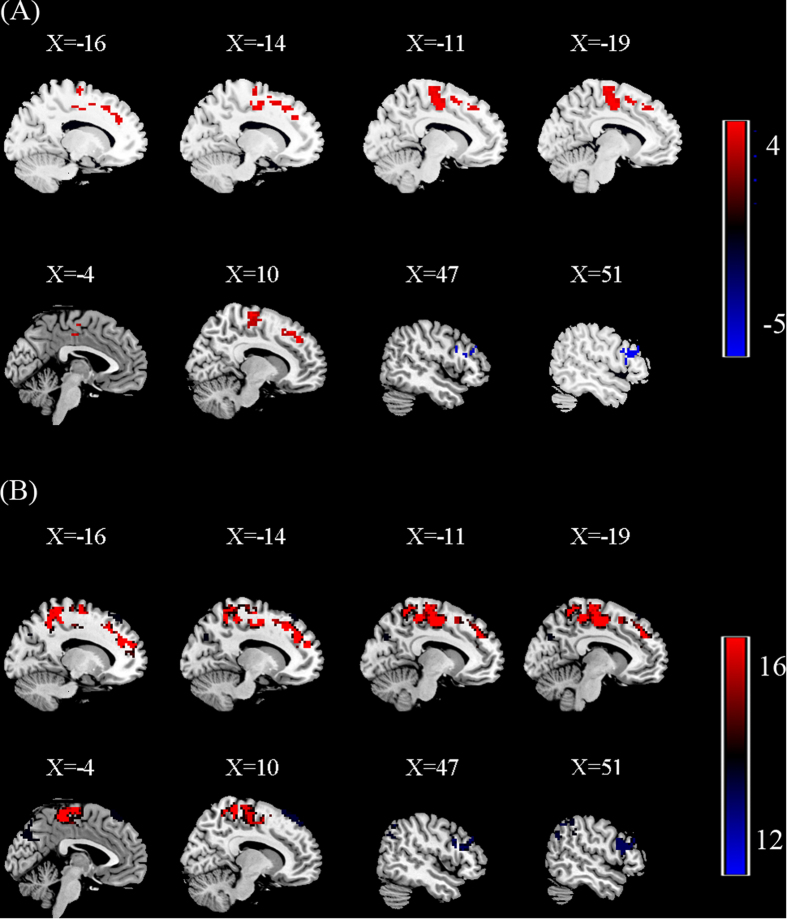
Figure 4.
(A) Split-half sample reproducibility. Group differences of fALFF were performed between 9 PNES patients and 10 healthy controls (HC) using two-sample t-tests. The results were corrected by AlphaSim. Regions showing increased (red) and decreased (blue) fALFF values in PNES compared to HC. Color bar indicates the T score. (B) Leave-one-out sample reproducibility. The group comparisons based upon the permutated samples (i.e., 17 PNES vs. 20 healthy controls) for total 18 times. For each voxel, the color bar indicates number of tests where this voxel exhibited significant group differences across the total 18 tests.

