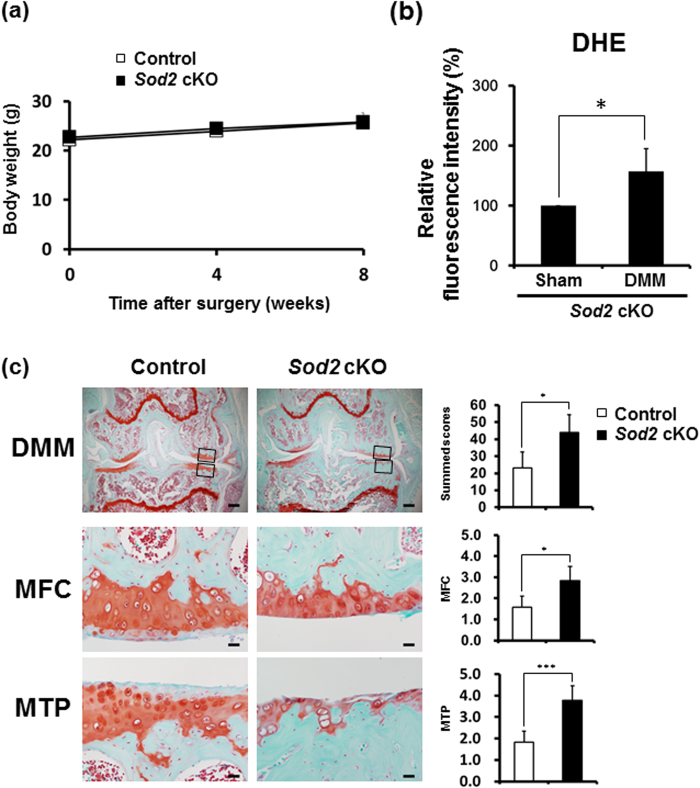
Figure 4. Loss of Sod2 in chondrocytes causes cartilage degeneration under an instability condition.
(a) Change in body weight of control and Sod2 cKO mice after DMM surgery (n = 7 for each time point). (b) Quantification of superoxide generation in tibial articular chondrocytes at two weeks after DMM surgery using flow cytometry with DHE staining. Error bars show the mean ± s.d. (n = 5, *P < 0.05 versus sham, Student’s t-test). (c) Cartilage degeneration in safranin O/Fast Green stained sections of the knee joint from control littermates and Sod2 cKO mice at eight weeks after DMM surgery. The right upper graph indicates the quantification of cartilage degeneration in whole knee joints; the right middle graph indicates the quantification of cartilage degeneration in MFC; and the right lower graph indicates the quantification of cartilage degeneration in MTP. Scale bars represent 200 μm and 20 μm for the low (top panels) and high (middle and low panels) magnifications, respectively. Values are the mean ± s.d. of five mice per group (*P < 0.05, ***P < 0.001 versus control, Student’s t-test).

