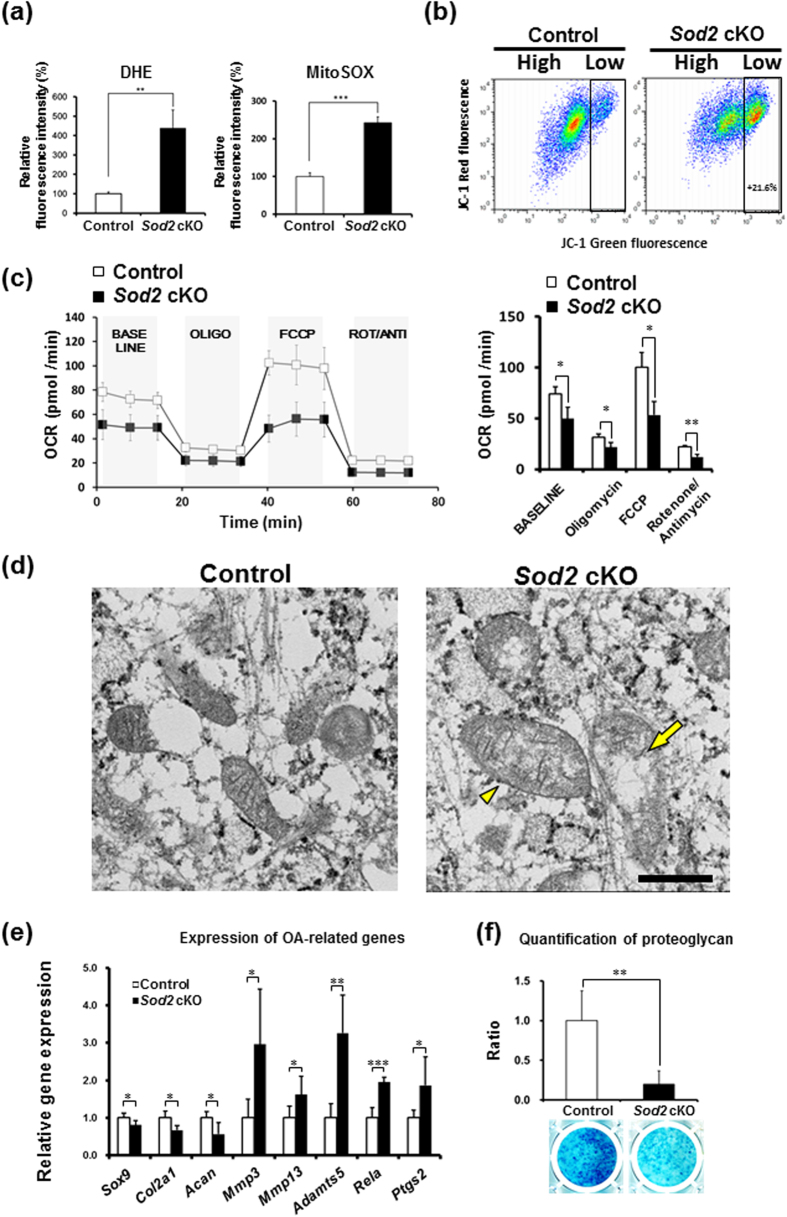
Figure 5. Sod2 deficiency in chondrocytes induces mitochondrial superoxide generation and dysfunction resulting in impaired extracellular matrix metabolism.
(a) Quantification of mitochondrial superoxide generation in Sod2 cKO chondrocytes at culture day 6. The left and right panels indicate DHE and MitoSOX staining, respectively. Values are the mean ± s.d. of five per each group (**P < 0.01, ***P < 0.001 versus control, Student’s t-test). (b) Mitochondrial membrane potential (ΔΨm) in primary chondrocytes at culture day 6 with JC-1 staining. High: the region of cells with normal ΔΨm, Low: the region of cells with mitochondrial depolarization. The proportion of cells with low ΔΨm in Sod2 cKO chondrocytes significantly increased at an average 21.6% compared with the controls. (c) OCR in primary Sod2 cKO chondrocytes. High: the region of cells with normal ΔΨm, Low: the region of cells with mitochondrial depolarization. Respirometry shows the sequential addition of mitochondrial metabolic inhibitors as described in Fig. 2 legend. The right graph indicates the quantification of the OCR following the sequential addition of mitochondrial metabolic inhibitors (n = 3, respectively, *P < 0.05, **P < 0.01 versus control, Student’s t-test). (d) Mitochondrial morphology in Sod2 cKO (right) and control (left) chondrocytes using an electron microscope. Scale bar represents 500 nm. A yellow arrowhead indicates a swollen mitochondria, a yellow arrow indicates disrupted mitochondrial cristae. (e) Expression profiles of OA-related genes in primary articular chondrocytes at culture day 6. Values are the mean ± s.d. of five per group (*P < 0.05, **P < 0.01, ***P < 0.001 versus control, Student’s t-test). (f) Proteoglycan levels in Sod2 cKO chondrocytes at culture day 28 using Alcian blue staining. Quantification of Alcian blue staining was achieved by QWin software (n = 3, **P < 0.01 versus control, Student’s t-test).

