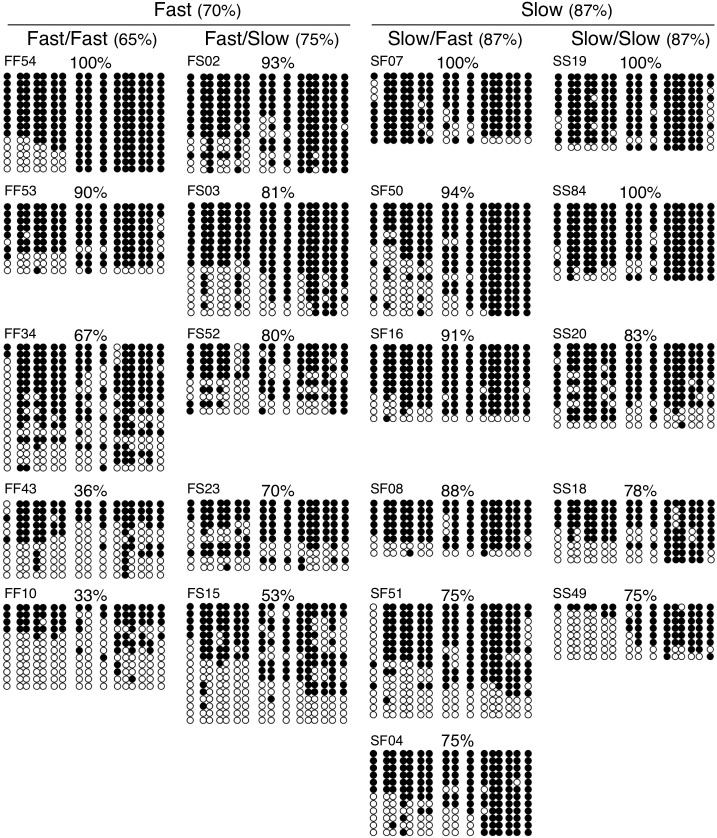
FIG. 5. .
Imprinted methylation analysis of the paternal H19 allele in fast, slow, fast/fast, fast/slow, slow/fast, and slow/slow groups. Mean hypermethylation levels shown in brackets. Each group of circles represents one embryo, with the embryo name indicated in the top left. Percent hypermethylation is indicated in the top middle. Each row represents one DNA strand. Filled circles represent methylated CpG dinucleotides while unfilled circles represent unmethylated CpGs. Only the data for the paternal allele are shown because no difference in the methylation status of the unmethylated maternal H19 allele was observed.

