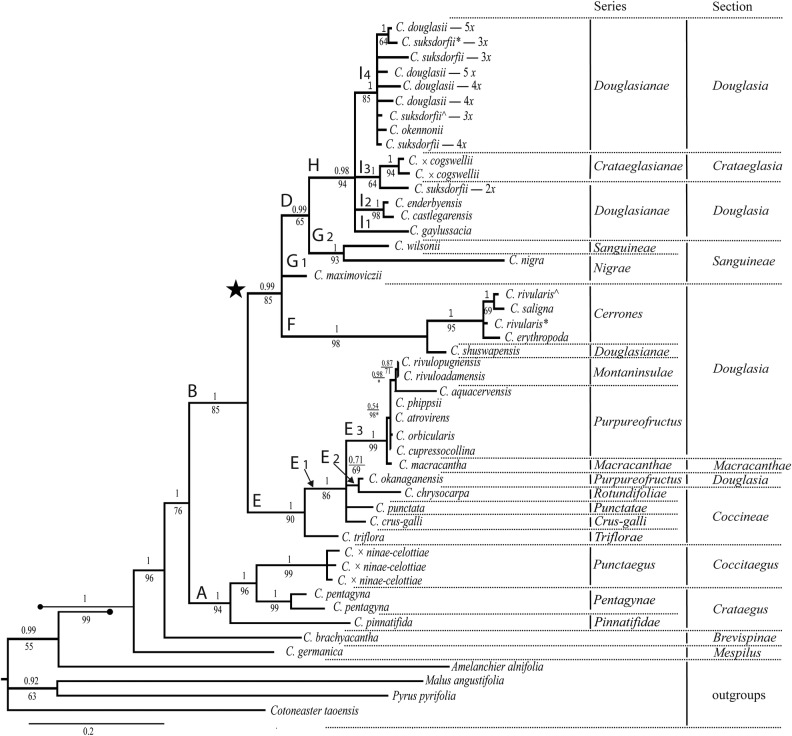
Figure 1.
Crataegus phylogram based on sequence data from 14 plastid loci [see Supporting Information—Table S2]; majority rule consensus of 15 000 Bayesian trees. Numbers above branches are PP; numbers below the branches are percent BS. For ease of comparison, clades are labelled as in Fig. 4 of Zarrei et al. (2014). Scale for branch lengths is substitutions per site. Crataegus suksdorfii 3x* = sampled from Haida Gwaii; C. suksdorfii 3x^ = sampled from Vancouver Island; C. rivularis* sampled from Colorado (NT273); C. rivularis^ sampled from Wyoming (2001–42). An asterisk following the bootstrap value indicates the branches collapse in the strict consensus tree of 18 trees. The infrageneric classification mapped onto the tree is based on Christensen et al. (2014), Dickinson et al. (in prep.) and Phipps (2015).

