
Figure 2.
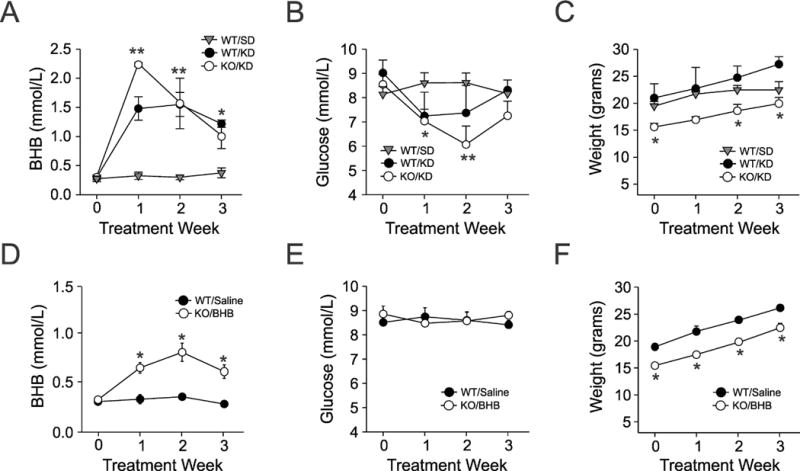
Metabolic parameters determined during the course of treatment. (A, B, C) Plasma β-hydroxybutyrate (BHB), blood glucose levels and weight changes in three cohorts of wild-type (WT) or Kcna1-null (KO) mice treated with either a standard diet (SD) or a ketogenic diet (KD). (D, E, F) Similar measurements made in separate groups of mice administered BHB through osmotic mini-pumps (N=12 mice in each group). Each symbol indicates the mean ± S.E.M; *p<0.05, **p<0.01. One-way ANOVA followed by Tukey test.