
Figure 1. Activation of ttx-3 expression by POP-1 and repression by SYS-1.
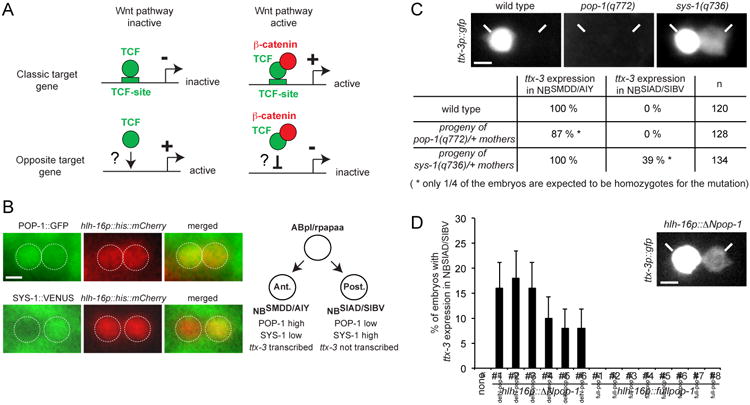
(A) Classic target genes are activated by TCF associated with β-catenin when the Wnt pathway is active and repressed by TCF when the Wnt pathway is inactive. Opposite target genes are activated by TCF when the Wnt pathway is inactive and repressed by the TCF:β-catenin complex when the Wnt pathway is active.
(B) Expression of the POP-1∷GFP (qIs74) and SYS-1∷VENUS (qIs95) fusion proteins in the NBSMDD/AIY (Ant.) and NBSIAD/SIBV (Post.) neuroblasts identified with the hlh-16p∷his∷mCherry transgene (promoter of the hlh-16 gene driving an histone fused to mCherry, stIs10546) at epidermal enclosure.
(C) Effect of pop-1 and sys-1 loss of function mutants on the initiation of ttx-3 expression (ttx-3p∷gfp, otIs173) at epidermal enclosure. As pop-1(q772) and sys-1(q736) homozygote mutants are lethal (at later embryonic stages), we scored the progeny of heterozygote mothers. Around 1/4 of the progeny displays a phenotype as expected from mendelian segregation (n = number of lineages analyzed). Note that in sys-1 mutants the ectopic expression in NBSIAD/SIBV is always weaker than the endogenous expression in NBSMDD/AIY (see picture). This may be due to the fact that sys-1 loss of function is only partial (due to maternal contribution) and/or to the fact that NBSIAD/SIBV has a lower nuclear concentration of POP-1 than NBSMDD/AIY. See also Figure S1.
(D) Expression of a POP-1 version lacking the SYS-1 interaction domain (hlh-16p∷ΔNpop-1) but not a full length version (hlh-16p∷fullpop-1) ectopically activates ttx-3 expression (ttx-3p∷gfp, mgIs18) in the NBSIAD/SIBV neuroblast. The hlh-16 promoter which drives expression in NBSMDD/AIY and NBSIAD/SIBV is used as a driver. 6 independent lines were analyzed for hlh-16p∷ΔNpop-1 and 8 for hlh-16p∷fullpop-1 (none: control without any pop-1 transgene). The percentage of embryos showing ectopic expression in each of the hlh-16p∷ΔNpop-1 lines is low but statistically significant (p<0.01, Fisher's exact test; n=50; error bars show standard error of proportion). Note that the ectopic expression in NBSIAD/SIBV is always weaker than the endogenous expression in NBSMDD/AIY (see picture). Scale bar = 2 μm.