
Figure 3. Regulation of the initiation of ttx-3 expression by REF-2, HLH-2, HLH-3 and HLH-16.
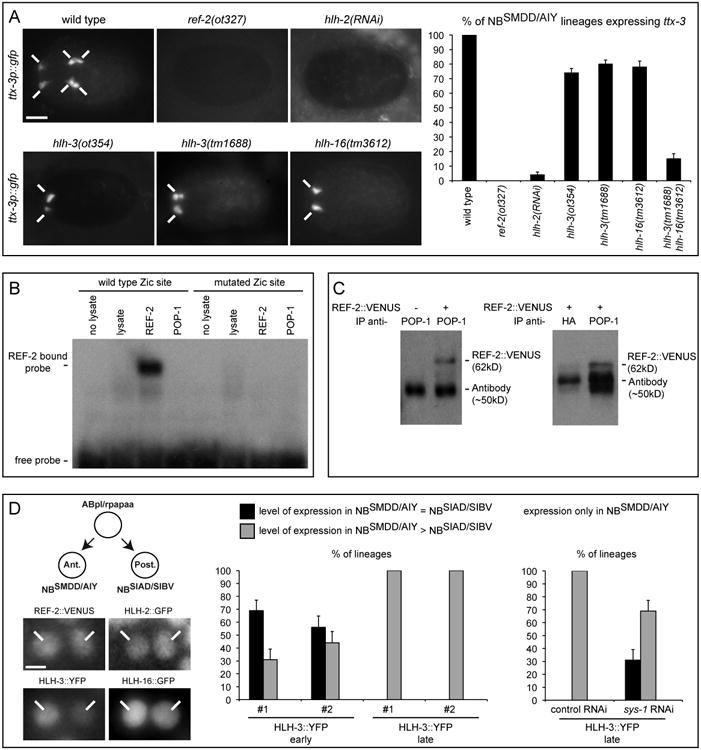
(A) Left: expression of ttx-3 (ttx-3p∷gfp) in embryos at epidermal enclosure just after division of the NBSMDD/AIY neuroblast (ventral view, anterior is left, scale bar = 10 μm, note that the expression of ttx-3 in the AIN lineage (AINm, an unrelated neuronal lineage that also expresses ttx-3) is affected by loss of ref-2 and hlh-2 function but not by loss of hlh-3 and hlh-16 function). Right: percentage of NBSMDD/AIY lineages that display expression of ttx-3 (ttx-3p∷gfp) at epidermal enclosure (n>100, error bars show standard error of proportion). See also Figure S3.
(B) EMSA using in vitro (reticulocyte lysate) produced REF-2 or POP-1 proteins on probes containing the wild type or mutated Zic site from the ttx-3 promoter. See also Figure S4.
(C) Coimmunoprecipitation from C. elegans embryos expressing the REF-2∷VENUS (otEx3091) translational fusion (+) or not (-), using an anti-POP-1 antibody or control anti-HA antibody for immunoprecipitation and an anti-VENUS antibody for western blot. (Note that in addition to the REF-2∷VENUS band (62kD) an additional band corresponding to the antibody used for immunoprecipitation (∼50kD) is also detected. The same quantity of anti-POP-1 and anti-HA antibodies were used in the immunoprecipitations, differences of intensity of the antibody band between anti- POP-1 and anti-HA reflects difference of affinity of these antibodies with the western blot antibodies).
(D) Left: expression of the translational fusions REF-2∷VENUS (otEx3091), HLH-2∷GFP (nIs47), HLH-3∷YFP (otEx4140), HLH-16∷GFP (otEx4503) in the NBSMDD/AIY (Ant.) and NBSIAD/SIBV (Post.) neuroblasts at epidermal enclosure (scale bar = 2 μm). Right: percentage of lineages expressing the translational fusion HLH-3∷YFP in both NBSMDD/AIY and NBSIAD/SIBV at similar level (black), in both NBSMDD/AIY and NBSIAD/SIBV with higher level in NBSMDD/AIY (grey), or only in NBSMDD/AIY (white). Two independent HLH-3∷YFP lines (#1 otEx4140, #2 otEx4142) were analyzed. Expression in the NBSMDD/AIY and NBSIAD/SIBV neuroblasts was scored early (during interphase) or late (when entering mitosis as monitored by chromosome condensation using hlh-16p∷his∷mCherry and by the appearance of the cleavage furrow). The effects of control and sys-1 RNAi were tested on otEx4140. (n>30, error bars show standard error of proportion).