
Fig. 3. LSD1 directly interacts with SHP and enhances its repression activity.
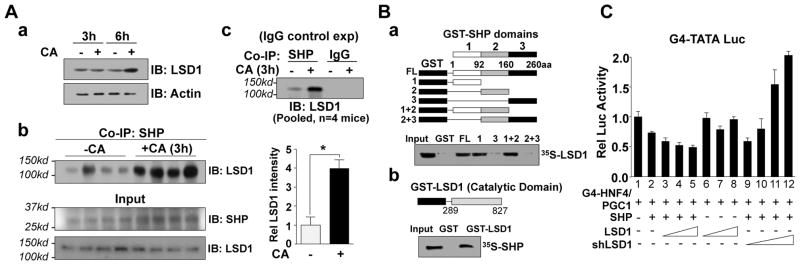
(A) CoIP: (A-a) Mice were fed CA chow for 3 h or 6 h, extracts were prepared from livers pooled from 4 mice and immunoblots (IB) were performed. (A-b) Mice were fed CA chow for 3 h and CoIP assays were performed. In the quantitative analysis, the band intensity for the control (-CA) group = 1. The mean and SEM are plotted and statistical significance was measured using Student’s t-test. *p <0.05 (n= 4). (A-c) CoIP assay with an IgG control. (B) GST-pull down: Schematic diagrams of fragments of SHP and LSD1 in GST fusion proteins are shown above the autoradiograms. LSD or SHP was 35S-labeled using the in vitro TNT system and interaction was detected by autoradiography. (C) Cos-1 cells were transfected with a Gal4-TATA-luc reporter and expression plasmids as indicated, and 36 h later, the cells were treated with CDCA overnight and reporter assays were performed. The mean and SEM (n=3) are plotted.