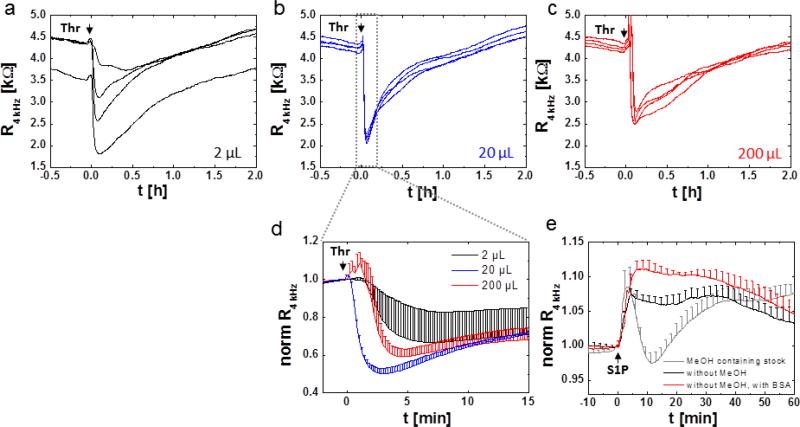
Fig. 10.
Influence of liquid handling during agonist addition and agonist preparation on signal intensity and reproducibility. a – c Color-coded response profiles of HDMEC cell layers grown on 8W10E+ electrodes after addition of thrombin using different fluid volumes for addition: a 2 μL of 200 × stock solution b 20 μL of 20 × stock solution c 200 μL of 2 × stock solution. A final concentration of 5 nM thrombin was reached in all conditions. The respective amount of medium is removed from the wells before the agonist is added to maintain a final volume of 400 μL. d Average and normalized response profiles of data from HDMEC layers shown in a – c. e Influence of different preparations of S1P working solutions on the response profiles of HDMEC cells upon stimulation with 1 μM S1P (arrows) (average and SD of N = 4). All S1P working solutions were prepared as a 20 × stock (20 μM) and added to reach a final well volume of 400 μL. Grey trace: S1P solution (1 mM) in methanol diluted (1:50) in low serum medium. Black trace: Methanol was evaporated from the S1P from the stock solution under a dry nitrogen stream and reconstituted in low serum medium with 5 min sonication. Red trace: Methanol was evaporated from the S1P stock solution as described above and reconstituted in HBSS with 0.03 mg/ml fatty acid-free BSA.

