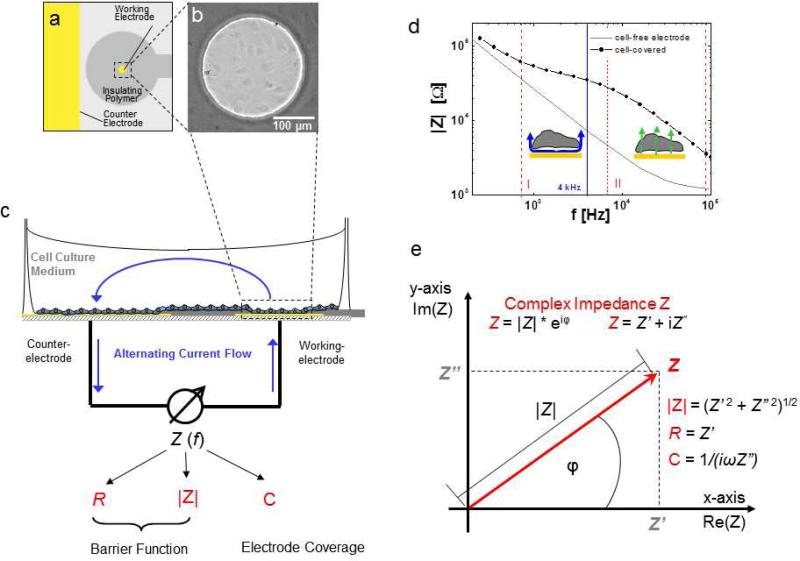
Fig. 3.
Principle of ECIS. a Schematic of co-planar two-electrode layout of one ECIS chamber viewed from top (yellow: gold electrode surfaces, grey: insulating polymer). b Phase contrast micrograph of an ECIS working electrode covered with HDMEC cells. c Schematic side view of ECIS chamber and principle of measurement. Electrical connection between the small working electrode (~ 5 × 10⁻⁴ cm2) and the significantly larger counter electrode is provided by the cell culture medium. Blue arrows, drawn unidirectionally for clarity, indicate the alternating current flow. The complex impedance Z of the system is measured as a function of frequency and comprises information on resistive (R) as well as capacitive (C) behavior of the system. Impedance magnitude |Z|, Ohmic resistance R and capacitance C are used as typical monitoring parameters to measure cell behavior. d The frequency dependent behavior of a cell-free and cell-covered electrode presented in a so-called Bode diagram, reflecting the impedance increase due to the cell layer between ~ 103 – 105 Hz. For the system presented here, the signal is dominated by the paracellular cell layer resistance between about 103 – 104 Hz (section I delineated by dashed red lines) and is increasingly influenced by capacitive currents across the cell membranes between 104 – 105 Hz (section II delineated by dashed red lines). e The complex impedance Z can be graphically presented as a vector in a complex plane. Herein, the complex impedance Z is described by the length of the vector, its magnitude |Z|, which is the ratio of the amplitudes V0 and I0 according to Ohm's law, and the angle between the vector and the x-axis, which describes the frequency-dependent phase shift φ. As expressed in Cartesian coordinates, the x-axis (Real axis in complex plane) describes the in-phase (real) portion of the impedance (no phase shift, i.e. ohmic resistance of the bulk and paracellular pathway), while the imaginary axis quantifies the 90° out-of-phase (imaginary) contribution (i.e. double layer capacitance at electrode-solution interface and membrane capacitance) for each frequency. Monitoring parameters |Z|, R and C can be calculated from real and imaginary contributions according to the given equations.

